
Concept explainers
Videos
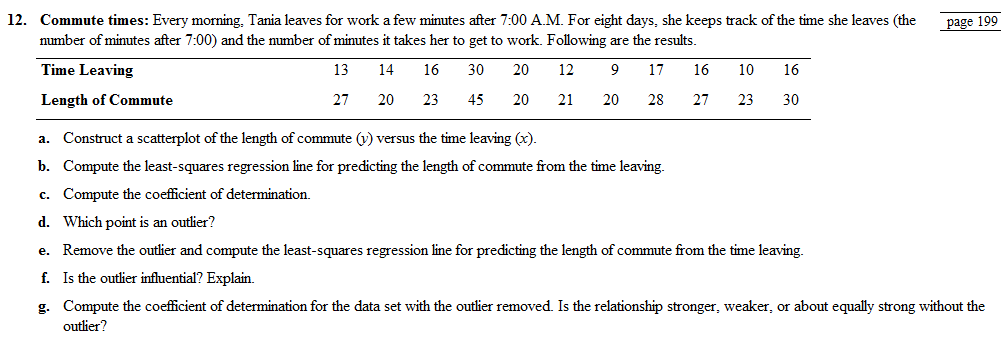
Commute times: Every morning, Tania leaves for work a few minutes after 7:00 A.M. For eight days, she keeps track of the time she leaves (the number of minutes after 7:00) and the number of minutes it takes her to get to work. Following are the results.
- Construct a
scatterplot of the length of commute (y) versus the time leaving (x). - Compute the least-squares regression line for predicting the length of commute from the time leaving.
- Compute the coefficient of determination.
- Which point is an outlier?
- Remove the outlier and compute the least-squares regression line for predicting the length of commute from the time leaving.
- Is the outlier influential? Explain.
- Compute the coefficient of determination for the data set with the outlier removed. Is the relationship stronger. weaker; or about equally strong without the outlier?
a.
To Graph:a scatter plot using the length of commute time
Explanation of Solution
Given information: T leaves her home every day few minutes after
Graph:The scatter plot shows the number of minutes after
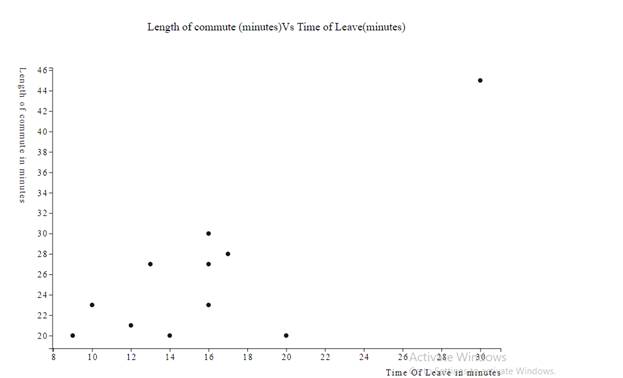
Interpretation:Each of the data in the table contributes an ordered pair of the form (number of minutes after
We use a scatter plot for this example because to understand the relationship between the two variables as ordered pairs it is useful. The points tend to cluster around the straight line. Therefore, we conclude that the variable on the
Now consider the three points
Therefore, we conclude that the variable on the
Because for positive linear relationship the large value of data associates with large values of data in the plot, while for negative linear relationship the large value of data associates with small values of data in the pot. And in this case, it is difficult to say that because the large values of data associate with both small and large and small values of data associate with both small and large at the same time.
Therefore it is good to measure how strong the linear relationship is, to know this we can calculate the correlation coefficient.
b.
To Calculate: the least square regression line
Answer to Problem 12RE
When two variables have a linear relationship, the points on a scatter plot tend to cluster around a straight line called the least square regression line. It is simplified to be
Explanation of Solution
Given information: T leaves her home every day few minutes after
Formulas Used:
Sample mean:
Sample variance:
Correlation Coefficient:
The least-square regression line:
Calculation: Using the below table for calculation.
The sample means and the sample variances can be calculated as shown.
Now, one can use these to calculate the correlation coefficient as shown.
Finally, to calculate the least square regression line as shown, theser can be used.
Where
c.
To Calculate: the coefficient of determination
Answer to Problem 12RE
The coefficient of determination is
Explanation of Solution
Given information: T leaves her home every day few minutes after
Formulas Used:
Sample mean:
Sample variance:
Correlation Coefficient:
Calculation: the correlation coefficient can be calculated as shown by using the formula.
The correlation coefficient
indicates a positive linear association. Here the value of the correlation coefficient close to zero.
Therefore, one can conclude that the positive linear relationship is weak.
Also,
To calculate the coefficient of determination we need to square the correlation coefficient.
Therefore, the coefficient of determination is
d.
To Find: the outlier point
Explanation of Solution
Given information: Tania leaves her home every day few minutes after
Graph: The scatter plot shows the number of minutes after
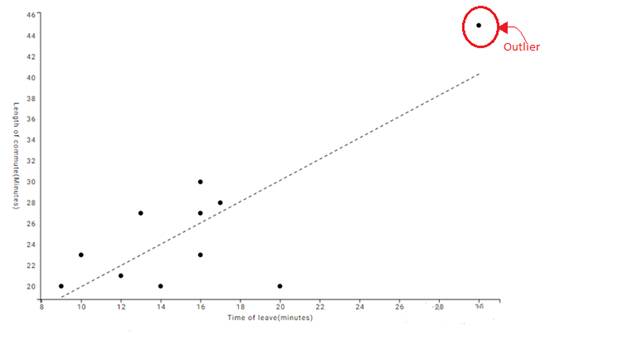
Interpretation: An outlier is a value that considerably larger or considerably smaller than most of the values in a data set. It may be resulting from an error in the process of sampling.
So in the given data set, an outlier point can be detected in the ordered pair
Because it is much larger than the other ordered pairs.
e.
To Calculate: the least square regression line without the outlier point.
Answer to Problem 12RE
The least square regression line without theoutlier point is
Explanation of Solution
Given information: T leaves her home every day few minutes after
Formulas Used:
Sample mean:
Sample variance:
Correlation Coefficient:
The least square regression line:
Calculation: the sample means and the sample variances can be calculated as shown without the outlier point.
Now, one can use these to calculate the correlation coefficient without the outlier as shown.
Finally, one can use these to calculate the least square regression line as shown.
Where
f.
To Show: the outlier is influential
Answer to Problem 12RE
No, the outlier is not that much influential.
Explanation of Solution
Given information: T leaves her home every day few minutes after
The least-square regression line with the outlier is
The least-square regression line without the outlier is
The two least square regression lines are so much close and have no huge difference.
Therefore we can conclude that the outlier is not that much influential. Here, the outlier cannot be a result of an error. It is just random data measured along with the other data in the sampling process.
g.
To Find: the coefficient of determination without the outlier and discuss its strength.
Answer to Problem 12RE
Coefficient of determination is
Explanation of Solution
Given information: T leaves her home every day few minutes after
Formula Used:Sample mean:
Sample variance:
Correlation Coefficient:
Calculation: to calculate the correlation coefficient without the outlier as shown.
The correlation coefficient
indicates a positive linear association. It is
The value is so close to zero .because of the ten to the power is minus thirty-one.
Therefore, one can conclude that the positive linear relationship is very weak without the outlier.
Also,
One can calculate the coefficient of determination by squaring the correlation coefficient.
Therefore, the coefficient of determination is
Want to see more full solutions like this?
Chapter 4 Solutions
Connect Hosted by ALEKS Online Access for Elementary Statistics


- You want to make a salad from whatever vegetable you have in the fridge. You have seven different tomatoes. There are 2 red tomatoes, 4 yellow tomatoes, and one black tomato in the fridge. You have three different bell peppers. There is 1 red pepper, 1 yellow pepper, and 1 green pepper. What is the probability of randomly choosing a vegetable and getting a red tomato, and a green pepper? Round your answer to four decimal places.arrow_forwarduppose automobile insurance companies gave annual premiums for top-rated companies in several states. The figure below shows box plots for the annual premium for urban customers in three states. Which state offers the lowest premium? Which state offers the highest premium?arrow_forwardWing Foot is a shoe franchise commonly found in shopping centers across the United States. Wing Foot knows that its stores will not show a profit unless they gross over $940,000 per year. Let A be the event that a new Wing Foot store grosses over $940,000 its first year. Let B be the event that a store grosses over $940,000 its second year. Wing Foot has an administrative policy of closing a new store if it does not show a profit in either of the first two years. Assume that the accounting office at Wing Foot provided the following information: 58% of all Wing Foot stores show a profit the first year; 72% of all Wing Foot store show a profit the second year (this includes stores that did not show a profit the first year); however, 86% of Wing Foot stores that showed a profit the first year also showed a profit the second year. Compute P(B|Ac). Round your answer to the nearest hundredth.arrow_forward
- You draw two cards from a standard deck of 52 cards, but before you draw the second card, you put the first one back and reshuffle the deck. If you get a3on the first card, find the probability of drawing a 3 for the second card.arrow_forwardDo bonds reduce the overall risk of an investment portfolio? Let x be a random variable representing annual percent return for the Vanguard Total Stock Index (all Stocks). Let y be a random variable representing annual return for the Vanguard Balanced Index (60% stock and 40% bond). For the past several years, assume the following data. Compute the coefficient of variation for each fund. Round your answers to the nearest tenth. x: 14 0 37 21 35 23 24 -14 -14 -17 y: 8 -2 29 17 22 17 17 -2 -3 -8arrow_forwardWhat percentage of the general U.S. population have bachelor's degrees? Suppose that the Statistical Abstract of the United States, 120th Edition, gives the following percentage of bachelor’s degrees by state. For convenience, the data are sorted in increasing order. 17 18 18 18 19 20 20 20 21 21 21 21 21 22 22 22 22 22 23 23 24 24 24 24 24 25 25 25 25 26 26 26 26 26 26 27 27 27 28 28 28 29 29 31 31 32 32 34 35 38 Illinois has a bachelor's degree percentage rate of about 18%. Into what quartile does this rate fall?arrow_forward
- What percentage of the general U.S. population have bachelor's degrees? Suppose that the Statistical Abstract of the United States, 120th Edition, gives the following percentage of bachelor’s degrees by state. For convenience, the data are sorted in increasing order. 17 18 18 18 19 20 20 20 21 21 21 21 21 22 22 22 22 22 23 23 24 24 24 24 24 25 25 25 25 26 26 26 26 26 26 27 27 27 28 28 28 29 29 31 31 32 32 34 35 38 Illinois has a bachelor's degree percentage rate of about 18%. Into what quartile does this rate fall?arrow_forwardFind the range for the following sample data. x 23 17 11 30 27arrow_forwardDo bonds reduce the overall risk of an investment portfolio? Let x be a random variable representing annual percent return for the Vanguard Total Stock Index (all Stocks). Let y be a random variable representing annual return for the Vanguard Balanced Index (60% stock and 40% bond). For the past several years, assume the following data. Compute the sample mean for x and for y. Round your answer to the nearest tenth. x: 11 0 36 22 34 24 25 -11 -11 -22 y: 9 -3 28 14 23 16 14 -3 -4 -9arrow_forward
- Do bonds reduce the overall risk of an investment portfolio? Let x be a random variable representing annual percent return for the Vanguard Total Stock Index (all Stocks). Let y be a random variable representing annual return for the Vanguard Balanced Index (60% stock and 40% bond). For the past several years, assume the following data. Compute the range for variable y. X 12 0 36 21 35 23 24 -12 -12 -21 Y 10 -2 26 15 22 18 15 -2 -3 -10arrow_forwardDo bonds reduce the overall risk of an investment portfolio? Let x be a random variable representing annual percent return for the Vanguard Total Stock Index (all Stocks). Let y be a random variable representing annual return for the Vanguard Balanced Index (60% stock and 40% bond). For the past several years, assume the following data. Compute the range for variable y. X 12 0 36 21 35 23 24 -12 -12 -21 Y 10 -2 26 15 22 18 15 -2 -3 -10arrow_forwardDo bonds reduce the overall risk of an investment portfolio? Let x be a random variable representing annual percent return for the Vanguard Total Stock Index (all Stocks). Let y be a random variable representing annual return for the Vanguard Balanced Index (60% stock and 40% bond). For the past several years, assume the following data. Compute the range for variable x. X 15 0 37 23 33 25 26 -15 -15 -23 Y 6 -1 28 18 24 17 18 -1 -2 -6arrow_forward
 College AlgebraAlgebraISBN:9781305115545Author:James Stewart, Lothar Redlin, Saleem WatsonPublisher:Cengage Learning
 Elementary Linear Algebra (MindTap Course List)AlgebraISBN:9781305658004Author:Ron LarsonPublisher:Cengage Learning
 Algebra and Trigonometry (MindTap Course List)AlgebraISBN:9781305071742Author:James Stewart, Lothar Redlin, Saleem WatsonPublisher:Cengage Learning
 Functions and Change: A Modeling Approach to Coll...AlgebraISBN:9781337111348Author:Bruce Crauder, Benny Evans, Alan NoellPublisher:Cengage Learning
 Linear Algebra: A Modern IntroductionAlgebraISBN:9781285463247Author:David PoolePublisher:Cengage Learning