
Videos
For its first 2 decades of existence, the NBA’s Orlando Magic basketball team set seat prices for its 41-game home
But when Anthony Perez, director of business strategy, finished his MBA at the University of Florida, he developed a valuable database of ticket sales. Analysis of the data led him to build a
Studying individual sales of Magic tickets on the open Stub Hub marketplace during the prior season, Perez determined the additional potential sales revenue the Magic could have made had they charged prices the fans had proven they were willing to pay on Stub Hub. This became his dependent variable, y, in a multiple-regression model.
He also found that three variables would help him build the “true market” seat price for every game. With his model, it was possible that the same seat in the arena would have as many as seven different prices created at season onset—sometimes higher than expected on average and sometimes lower.
The major factors he found to be statistically significant in determining how high the demand for a game ticket, and hence, its price, would be were:
► The day of the week (x1)
► A rating of how popular the opponent was (x2)
► The time of the year (x3)
For the day of the week, Perez found that Mondays were the least-favored game days (and he assigned them a value of 1). The rest of the weekdays increased in popularity, up to a Saturday game, which he rated a 6. Sundays and Fridays received 5 ratings, and holidays a 3 (refer to the footnote in Table 4.2).
Fernado Medina
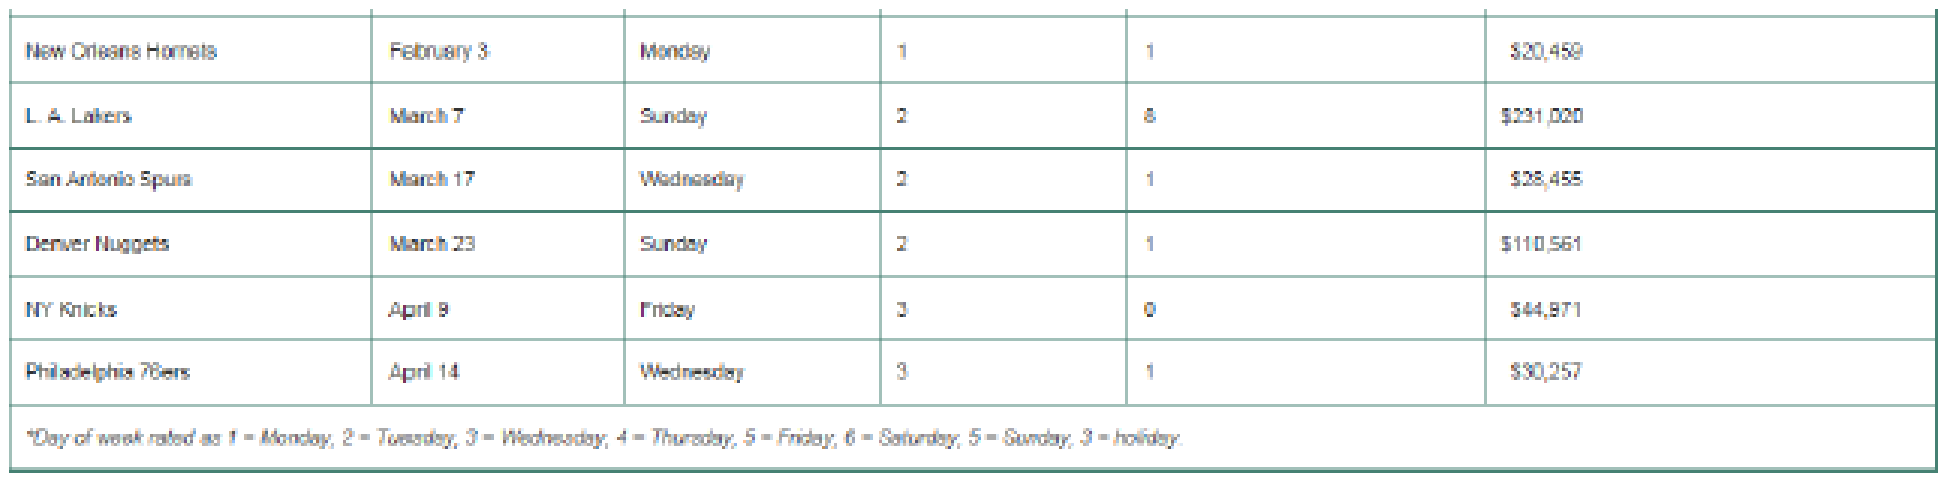
TABLE 4.2 Data for Last Year’s Magic Ticket Sales Pricing Model
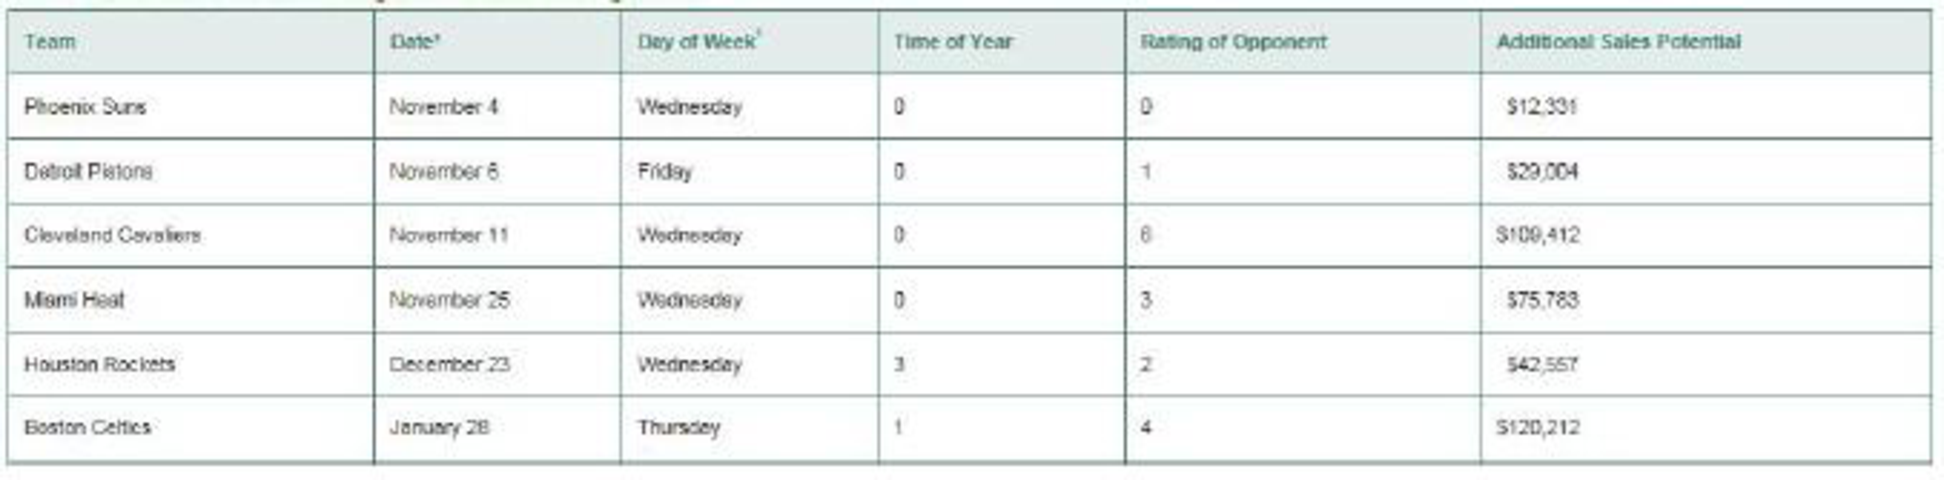
His ratings of opponents, done just before the start of the season, were subjective and range from a low of 0 to a high of 8. A very high-rated team in that particular season may have had one or more superstars on its roster, or have won the NBA finals the prior season, making it a popular fan draw.
Finally, Perez believed that the NBA season could be divided into four periods in popularity:
► Early games (which he assigned 0 scores)
► Games during the Christmas season (assigned a 3)
► Games until the All-Star break (given a 2)
► Games leading into the play-offs (scored with a 3)
The first year Perez built his multiple-regression model, the dependent variable y, which was a “potential premium revenue score,” yielded an R2 =.86 with this equation:
Table 4.2 illustrates, for brevity in this case study, a sample of 12 games that year (out of the total 41 home game regular season), including the potential extra revenue per game (y) to be expected using the variable pricing model.
A leader in NBA variable pricing, the Orlando Magic have learned that regression analysis is indeed a profitable forecasting tool.
1. Use the data in Table 4.2 to build a regression model with day of the week as the only independent variable.
3. Using Perez’s multiple-regression model, what would be the additional sales potential of a Thursday Miami Heat game played during the Christmas holiday?
Want to see the full answer?
Check out a sample textbook solution
Chapter 4 Solutions
Operations Management


- Main Challenges at TechInnovateStrategic DirectionTechInnovate's board of directors is pushing for a more aggressive expansion into emerging markets, particularly in Africaand Southeast Asia. However, there's internal disagreement about whether to focus on these new markets or consolidatetheir position in existing ones. Sarah Chen favors rapid expansion, while some senior executives advocate for a morecautious approach.Ethical ConcernsThe company's AI algorithms have come under scrutiny for potential biases, particularly in facial recognition technology.There are concerns that these biases disproportionately affect minority groups. Some employees have voiced ethicalconcerns about selling this technology to law enforcement agencies without addressing these issues.Team Leadership and DiversityTechInnovate's leadership team is predominantly male and Western, despite its global presence. There's growing pressurefrom employees and some board members to diversify the leadership team to…arrow_forwardSarah Anderson, the Marketing Manager at Exeter Township's Cultural Center, is conducting research on the attendance history for cultural events in the area over the past ten years. The following data has been collected on the number of attendees who registered for events at the cultural center. Year Number of Attendees 1 700 2 248 3 633 4 458 5 1410 6 1588 7 1629 8 1301 9 1455 10 1989 You have been hired as a consultant to assist in implementing a forecasting system that utilizes various forecasting techniques to predict attendance for Year 11. a) Calculate the Three-Period Simple Moving Average b) Calculate the Three-Period Weighted Moving Average (weights: 50%, 30%, and 20%; use 50% for the most recent period, 30% for the next most recent, and 20% for the oldest) c) Apply Exponential Smoothing with the smoothing constant alpha = 0.2. d) Perform a Simple Linear Regression analysis and provide the adjusted…arrow_forwardRuby-Star Incorporated is considering two different vendors for one of its top-selling products which has an average weekly demand of 70 units and is valued at $90 per unit. Inbound shipments from vendor 1 will average 390 units with an average lead time (including ordering delays and transit time) of 4 weeks. Inbound shipments from vendor 2 will average 490 units with an average lead time of 2 weeksweeks. Ruby-Star operates 52 weeks per year; it carries a 4-week supply of inventory as safety stock and no anticipation inventory. Part 2 a. The average aggregate inventory value of the product if Ruby-Star used vendor 1 exclusively is $enter your response here.arrow_forward
- Sam's Pet Hotel operates 50 weeks per year, 6 days per week, and uses a continuous review inventory system. It purchases kitty litter for $13.00 per bag. The following information is available about these bags: > Demand 75 bags/week > Order cost = $52.00/order > Annual holding cost = 20 percent of cost > Desired cycle-service level = 80 percent >Lead time = 5 weeks (30 working days) > Standard deviation of weekly demand = 15 bags > Current on-hand inventory is 320 bags, with no open orders or backorders. a. Suppose that the weekly demand forecast of 75 bags is incorrect and actual demand averages only 50 bags per week. How much higher will total costs be, owing to the distorted EOQ caused by this forecast error? The costs will be $higher owing to the error in EOQ. (Enter your response rounded to two decimal places.)arrow_forwardYellow Press, Inc., buys paper in 1,500-pound rolls for printing. Annual demand is 2,250 rolls. The cost per roll is $625, and the annual holding cost is 20 percent of the cost. Each order costs $75. a. How many rolls should Yellow Press order at a time? Yellow Press should order rolls at a time. (Enter your response rounded to the nearest whole number.)arrow_forwardPlease help with only the one I circled! I solved the others :)arrow_forward
- Osprey Sports stocks everything that a musky fisherman could want in the Great North Woods. A particular musky lure has been very popular with local fishermen as well as those who buy lures on the Internet from Osprey Sports. The cost to place orders with the supplier is $40/order; the demand averages 3 lures per day, with a standard deviation of 1 lure; and the inventory holding cost is $1.00/lure/year. The lead time form the supplier is 10 days, with a standard deviation of 2 days. It is important to maintain a 97 percent cycle-service level to properly balance service with inventory holding costs. Osprey Sports is open 350 days a year to allow the owners the opportunity to fish for muskies during the prime season. The owners want to use a continuous review inventory system for this item. Refer to the standard normal table for z-values. a. What order quantity should be used? lures. (Enter your response rounded to the nearest whole number.)arrow_forwardIn a P system, the lead time for a box of weed-killer is two weeks and the review period is one week. Demand during the protection interval averages 262 boxes, with a standard deviation of demand during the protection interval of 40 boxes. a. What is the cycle-service level when the target inventory is set at 350 boxes? Refer to the standard normal table as needed. The cycle-service level is ☐ %. (Enter your response rounded to two decimal places.)arrow_forwardOakwood Hospital is considering using ABC analysis to classify laboratory SKUs into three categories: those that will be delivered daily from their supplier (Class A items), those that will be controlled using a continuous review system (B items), and those that will be held in a two bin system (C items). The following table shows the annual dollar usage for a sample of eight SKUs. Fill in the blanks for annual dollar usage below. (Enter your responses rounded to the mearest whole number.) Annual SKU Unit Value Demand (units) Dollar Usage 1 $1.50 200 2 $0.02 120,000 $ 3 $1.00 40,000 $ 4 $0.02 1,200 5 $4.50 700 6 $0.20 60,000 7 $0.90 350 8 $0.45 80arrow_forward
- A part is produced in lots of 1,000 units. It is assembled from 2 components worth $30 total. The value added in production (for labor and variable overhead) is $30 per unit, bringing total costs per completed unit to $60 The average lead time for the part is 7 weeks and annual demand is 3800 units, based on 50 business weeks per year. Part 2 a. How many units of the part are held, on average, in cycle inventory? enter your response here unitsarrow_forwardassume the initial inventory has no holding cost in the first period and back orders are not permitted. Allocating production capacity to meet demand at a minimum cost using the transportation method. What is the total cost? ENTER your response is a whole number (answer is not $17,000. That was INCORRECT)arrow_forwardRegular Period Time Overtime Supply Available puewag Subcontract Forecast 40 15 15 40 2 35 40 28 15 15 20 15 22 65 60 Initial inventory Regular-time cost per unit Overtime cost per unit Subcontract cost per unit 20 units $100 $150 $200 Carrying cost per unit per month 84arrow_forward
 Purchasing and Supply Chain ManagementOperations ManagementISBN:9781285869681Author:Robert M. Monczka, Robert B. Handfield, Larry C. Giunipero, James L. PattersonPublisher:Cengage Learning
 Practical Management ScienceOperations ManagementISBN:9781337406659Author:WINSTON, Wayne L.Publisher:Cengage,