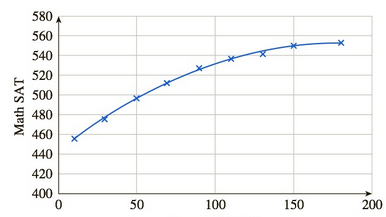
SAT Scores by Income The following graph shown U.S. math SAT scores as a function of parents’ income level. 81 Income ($1,000). The regression curve shown is given by f ( x ) = − 0.0034 x 2 + 1.2 x + 444 ( 10 ≤ x ≤ 180 ) where f ( x ) is the average math SAT score of a student whose parents earn x thousand dollars per year. Compute and interpret f ′ ( 30 ) .
SAT Scores by Income The following graph shown U.S. math SAT scores as a function of parents’ income level. 81 Income ($1,000). The regression curve shown is given by f ( x ) = − 0.0034 x 2 + 1.2 x + 444 ( 10 ≤ x ≤ 180 ) where f ( x ) is the average math SAT score of a student whose parents earn x thousand dollars per year. Compute and interpret f ′ ( 30 ) .
Solution Summary: The author analyzes the function f(x) and the graph which shows the U.S. math SAT scores as a function of parents income level.
SAT Scores by Income The following graph shown U.S. math SAT scores as a function of parents’ income level.81
Income ($1,000).
The regression curve shown is given by
f
(
x
)
=
−
0.0034
x
2
+
1.2
x
+
444
(
10
≤
x
≤
180
)
where
f
(
x
)
is the average math SAT score of a student whose parents earn x thousand dollars per year. Compute and interpret
f
′
(
30
)
.
Use Euler's method to numerically integrate
dy
dx
-2x+12x² - 20x +8.5
from x=0 to x=4 with a step size of 0.5. The initial condition at x=0 is y=1. Recall
that the exact solution is given by y = -0.5x+4x³- 10x² + 8.5x+1
Find an equation of the line tangent to the graph of f(x) = (5x-9)(x+4) at (2,6).
Find the point on the graph of the given function at which the slope of the tangent line is the given slope.
2
f(x)=8x²+4x-7; slope of the tangent line = -3
Need a deep-dive on the concept behind this application? Look no further. Learn more about this topic, calculus and related others by exploring similar questions and additional content below.
Correlation Vs Regression: Difference Between them with definition & Comparison Chart; Author: Key Differences;https://www.youtube.com/watch?v=Ou2QGSJVd0U;License: Standard YouTube License, CC-BY
Correlation and Regression: Concepts with Illustrative examples; Author: LEARN & APPLY : Lean and Six Sigma;https://www.youtube.com/watch?v=xTpHD5WLuoA;License: Standard YouTube License, CC-BY


 Algebra & Trigonometry with Analytic GeometryAlgebraISBN:9781133382119Author:SwokowskiPublisher:Cengage
 Algebra and Trigonometry (MindTap Course List)AlgebraISBN:9781305071742Author:James Stewart, Lothar Redlin, Saleem WatsonPublisher:Cengage Learning
 College AlgebraAlgebraISBN:9781305115545Author:James Stewart, Lothar Redlin, Saleem WatsonPublisher:Cengage Learning
 Glencoe Algebra 1, Student Edition, 9780079039897...AlgebraISBN:9780079039897Author:CarterPublisher:McGraw Hill
 Functions and Change: A Modeling Approach to Coll...AlgebraISBN:9781337111348Author:Bruce Crauder, Benny Evans, Alan NoellPublisher:Cengage Learning