
Concept explainers
Videos
a.
To state: whether an exponential, Gaussian, logarithmic, logistic, or quadratic model will fit the data best, for given graph and then describe a real- life situation that could be represents by the data.
a.
Answer to Problem 66E
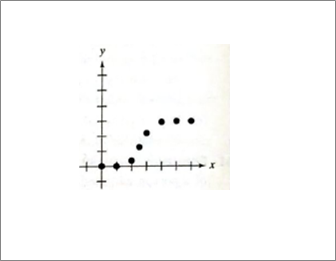
Logarithmic, decreasing between points, example—Richter scale.
Explanation of Solution
Given information: Given graph is shown below.

Calculation:
Logarithmic, decreasing between points, example—Richter scale.
b.
To state: whether an exponential, Gaussian, logarithmic, logistic, or quadratic model will fit the data best, for given graph and then describe a real- life situation that could be represents by the data.
b.
Answer to Problem 66E
Logistic growth, rapid growth, example- Declining growth, population.
Explanation of Solution
Given information: Given graph is shown below.
Calculation:
Logistic growth, rapid growth, example- Declining growth, population.
c.
To state: whether an exponential, Gaussian, logarithmic, logistic, or quadratic model will fit the data best, for given graph and then describe a real- life situation that could be represents by the data.
c.
Answer to Problem 66E
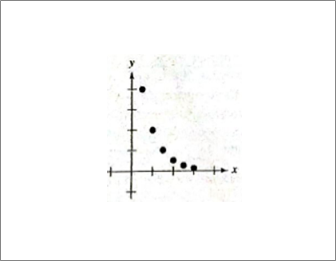
Exponential decay, decreasing same %, example—population.
Explanation of Solution
Given information: Given graph is shown below.
Calculation:
Exponential decay, decreasing same %, example—population.
d.
To state: whether an exponential, Gaussian, logarithmic, logistic, or quadratic model will fit the data best, for given graph and then describe a real- life situation that could be represents by the data.
d.
Answer to Problem 66E
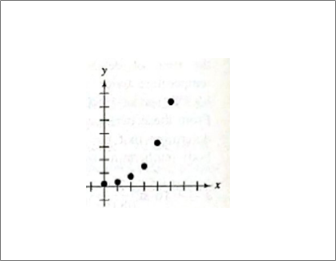
Exponential growth, increasing same %, example—population.
Explanation of Solution
Given information: Given graph is shown below.
Calculation:
Exponential growth, increasing same %, example—population.
e.
To state: whether an exponential, Gaussian, logarithmic, logistic, or quadratic model will fit the data best, for given graph and then describe a real- life situation that could be represents by the data.
e.
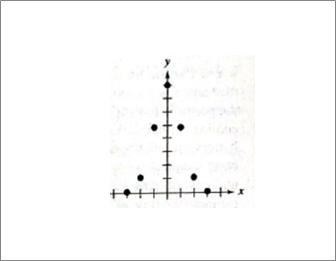
Answer to Problem 66E
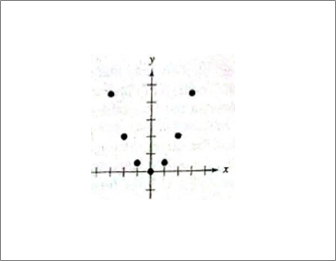
Quadratic, points reflected across y −axis, example-- throwing a ball.
Explanation of Solution
Given information: Given graph is shown below.
Calculation:
Quadratic, points reflected across y −axis, example-- throwing a ball.
f.
To state: whether an exponential, Gaussian, logarithmic, logistic, or quadratic model will fit the data best, for given graph and then describe a real- life situation that could be represents by the data.
f.
Answer to Problem 66E
Gaussian, bell shaped curve, example—probability and statistics.
Explanation of Solution
Given information: Given graph is shown below.
Calculation:
Gaussian, bell shaped curve, example—probability and statistics.
Chapter 3 Solutions
PRECALCULUS W/LIMITS:GRAPH.APPROACH(HS)


- Force with 800 N and 400 N are acting on a machine part at 30° and 60°, respectively with a positive x axis, Draw the diagram representing this situationarrow_forwardI forgot to mention to you to solve question 1 and 2. Can you solve it using all data that given in the pict i given and can you teach me about that.arrow_forwardexam review please help!arrow_forward
 Calculus: Early TranscendentalsCalculusISBN:9781285741550Author:James StewartPublisher:Cengage Learning
 Thomas' Calculus (14th Edition)CalculusISBN:9780134438986Author:Joel R. Hass, Christopher E. Heil, Maurice D. WeirPublisher:PEARSON
 Calculus: Early Transcendentals (3rd Edition)CalculusISBN:9780134763644Author:William L. Briggs, Lyle Cochran, Bernard Gillett, Eric SchulzPublisher:PEARSON
 Calculus: Early TranscendentalsCalculusISBN:9781319050740Author:Jon Rogawski, Colin Adams, Robert FranzosaPublisher:W. H. Freeman
 Calculus: Early Transcendental FunctionsCalculusISBN:9781337552516Author:Ron Larson, Bruce H. EdwardsPublisher:Cengage Learning