
Concept explainers
Videos
a.
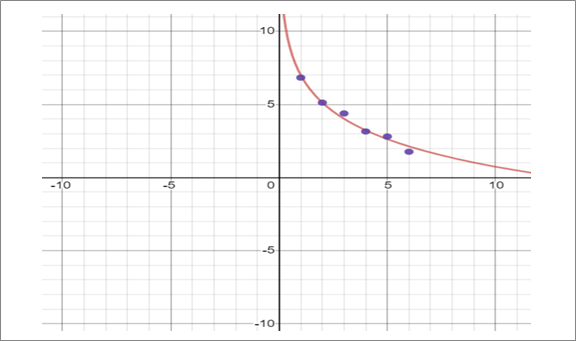
To graph: the model and plot the data in the same viewing window using graphing utility.
Given information: The table shows the population P (in hundreds) of an endangered
species from 2011 through 2016.The data can be modeled by;
| Year ( t ) | Population, P |
| 2011 | 6.83 |
| 2012 | 5.12 |
| 2013 | 4.38 |
| 2014 | 3.15 |
| 2015 | 2.8 |
| 2016 | 1.76 |
Calculation:
The table data can be written as:
| Year ( t ) | Population, P |
| 1 | 6.83 |
| 2 | 5.12 |
| 3 | 4.38 |
| 4 | 3.15 |
| 5 | 2.8 |
| 6 | 1.76 |
The graph of the model and the above table data in the same viewing window is shown below.
b.
To approximate : the population each year from 20011 to 2016 using the model.
Given information:
Calculation:
c.
To compare: the estimated value to the actual data and find is the model a good fit for the data.
Yes, the model a good fit for the data because the difference between the estimated values and actual data is very less.
Given information:
Calculation:
Actual values of data are:
| Year ( t ) | Population, P |
| 2011 | 6.83 |
| 2012 | 5.12 |
| 2013 | 4.38 |
| 2014 | 3.15 |
| 2015 | 2.8 |
| 2016 | 1.76 |
Estimated values of data are:
| Year ( t ) | Population, P |
| 2011 | 7 |
| 2012 | 5.11 |
| 2013 | 4.01 |
| 2014 | 3.23 |
| 2015 | 2.62 |
| 2016 | 2.13 |
Yes, the model a good fit for the data because the difference between the estimated values and actual data is very less.
This is also clear from above graph of the model with the actual data.
d.
To find: when will the species become extinct according to the model.
Species become extinct in 2023.
Given information:
Calculation:
Species become extinct when p = 0.
Therefore, the Species become extinct in 2010+13=2023.
Chapter 3 Solutions
PRECALCULUS W/LIMITS:GRAPH.APPROACH(HS)


- Find the accumulated amount A, if the principal P is invested at an interest rate of r per year for t years. (Round your answer to the nearest cent.) P = $3800, r = 4%, t = 10, compounded semiannually A = $ 5645.60 × Need Help? Read It SUBMIT ANSWER [3.33/6.66 Points] DETAILS MY NOTES REVIOUS ANSWERS ASK YOUR TEACHER TANAPCALC10 5.3.001.EP. PRACTICE ANOTHER Consider the following where the principal P is invested at an interest rate of r per year for t years. P = $3,100, r = 4%, t = 10, compounded semiannually Determine m, the number of conversion periods per year. 2 Find the accumulated amount A (in dollars). (Round your answer to the nearest cent.) A = $ 4604.44arrow_forwardForce with 800 N and 400 N are acting on a machine part at 30° and 60°, respectively with a positive x axis, Draw the diagram representing this situationarrow_forwardI forgot to mention to you to solve question 1 and 2. Can you solve it using all data that given in the pict i given and can you teach me about that.arrow_forward
 Calculus: Early TranscendentalsCalculusISBN:9781285741550Author:James StewartPublisher:Cengage Learning
 Thomas' Calculus (14th Edition)CalculusISBN:9780134438986Author:Joel R. Hass, Christopher E. Heil, Maurice D. WeirPublisher:PEARSON
 Calculus: Early Transcendentals (3rd Edition)CalculusISBN:9780134763644Author:William L. Briggs, Lyle Cochran, Bernard Gillett, Eric SchulzPublisher:PEARSON
 Calculus: Early TranscendentalsCalculusISBN:9781319050740Author:Jon Rogawski, Colin Adams, Robert FranzosaPublisher:W. H. Freeman
 Calculus: Early Transcendental FunctionsCalculusISBN:9781337552516Author:Ron Larson, Bruce H. EdwardsPublisher:Cengage Learning