Concept explainers
Videos
a.
The rate of change of prices from 2006 to 2008 and explain the meaning of the rate of change
a.
Answer to Problem 3CYU
The rate of change is 1.035.
Explanation of Solution
Given:

Calculation:
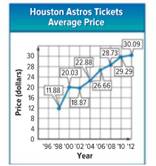
From the given graph, the ordered pairs for the year 2006 and 2008 are (6,26.66) and (8,28.73).
Formula used:
For two points
The rate of change is =
Calculation:
The required rate of change is:
Interpretation:
The rate of change is 1.035. It means that in 2 years there is an increase of $1.035 in the price of the tickets.
Conclusion:
The rate of change for the year 2006 and 2008 is 1.035.
b.
The period of years which has the highest rate of change
b.
Answer to Problem 3CYU
1998-2000
Explanation of Solution
Given:

In order to find out the highest rate, find the consecutive rise in prices.
The interval with the highest difference will be the answer.
Calculation:
| Interval (Years) | Difference of prices ($) |
| 1998-2000 | (20.03-11.88)=8.15 |
| 2000-2002 | (18.87-20.03)= -1.16 |
| 2002-2004 | (22.88-18.87)=4.01 |
| 2004-2006 | (26.66-22.88)=3.78 |
| 2006-2008 | (28.73-26.66)=2.07 |
| 2008-2010 | (29.29-28.73)=0.56 |
| 2010-2012 | (30.09-29.29)=0.8 |
Interpretation:
From the table above, the highest value of difference in price is for the year interval 1998-2000.
Conclusion:
Hence, the required interval is 1998-2000.
c.
The year in which the new stadium was built.
c.
Answer to Problem 3CYU
1994-1998
Explanation of Solution
Given:
Interpretation:
When the given graph is observed it can be seen that there is no data of price related to the year interval 1994-1996 and 1996-1998 which means that there were no price set for the tickets and this could only happen if there was no stadium at that time.
This means that the stadium was on a construction during this period and the year of start of construction was 1994. It can be interpreted because the staring of the graph was in the year 1994.
Conclusion:
Hence, it can be concluded that the stadium was built in the years 1994-1998.
Chapter 3 Solutions
Algebra 1, Homework Practice Workbook (MERRILL ALGEBRA 1)
Additional Math Textbook Solutions
Introductory Statistics
University Calculus: Early Transcendentals (4th Edition)
Elementary Statistics: Picturing the World (7th Edition)
Intro Stats, Books a la Carte Edition (5th Edition)
Thinking Mathematically (6th Edition)


- Safari File Edit View History Bookmarks Window Help Ο Ω OV O mA 0 mW ర Fri Apr 4 1 222 tv A F9 F10 DII 4 F6 F7 F8 7 29 8 00 W E R T Y U S D பட 9 O G H J K E F11 + 11 F12 O P } [arrow_forwardSo confused. Step by step instructions pleasearrow_forwardIn simplest terms, Sketch the graph of the parabola. Then, determine its equation. opens downward, vertex is (- 4, 7), passes through point (0, - 39)arrow_forward
- In simplest way, For each quadratic relation, find the zeros and the maximum or minimum. a) y = x 2 + 16 x + 39 b) y = 5 x2 - 50 x - 120arrow_forwardIn simplest terms and step by step Write each quadratic relation in standard form, then fi nd the zeros. y = - 4( x + 6)2 + 36arrow_forwardIn simplest terms and step by step For each quadratic relation, find the zeros and the maximum or minimum. 1) y = - 2 x2 - 28 x + 64 2) y = 6 x2 + 36 x - 42arrow_forward
- Write each relation in standard form a)y = 5(x + 10)2 + 7 b)y = 9(x - 8)2 - 4arrow_forwardIn simplest form and step by step Write the quadratic relation in standard form, then fi nd the zeros. y = 3(x - 1)2 - 147arrow_forwardStep by step instructions The path of a soccer ball can be modelled by the relation h = - 0.1 d 2 + 0.5 d + 0.6, where h is the ball’s height and d is the horizontal distance from the kicker. a) Find the zeros of the relation.arrow_forward
 Algebra and Trigonometry (6th Edition)AlgebraISBN:9780134463216Author:Robert F. BlitzerPublisher:PEARSON
 Contemporary Abstract AlgebraAlgebraISBN:9781305657960Author:Joseph GallianPublisher:Cengage Learning
 Linear Algebra: A Modern IntroductionAlgebraISBN:9781285463247Author:David PoolePublisher:Cengage Learning
 Algebra And Trigonometry (11th Edition)AlgebraISBN:9780135163078Author:Michael SullivanPublisher:PEARSON
 Introduction to Linear Algebra, Fifth EditionAlgebraISBN:9780980232776Author:Gilbert StrangPublisher:Wellesley-Cambridge Press
 College Algebra (Collegiate Math)AlgebraISBN:9780077836344Author:Julie Miller, Donna GerkenPublisher:McGraw-Hill Education