
Concept explainers
Videos
(a)
To find the
(a)
Answer to Problem 35E
Median
Explanation of Solution
Given:
The data for Giants’ salaries is given by
| 19.00 | 18.25 | 16.17 | 10.00 | 8.50 |
| 6.00 | 6.00 | 5.00 | 4.85 | 4.25 |
| 3.20 | 3.00 | 2.20 | 1.58 | 1.30 |
| 1.25 | 1.00 | 0.75 | 0.63 | 0.62 |
| 0.56 | 0.48 | 0.48 | 0.48 | 0.48 |
| 0.48 | 0.48 | 0.48 | 0.48 |
Formula used:
First quartile
If
Third quartile
If
Median is given by
Calculation:
Given data sorted in ascending order:
| x |
| 0.48 |
| 0.48 |
| 0.48 |
| 0.48 |
| 0.48 |
| 0.48 |
| 0.48 |
| 0.48 |
| 0.56 |
| 0.62 |
| 0.63 |
| 0.75 |
| 1.00 |
| 1.25 |
| 1.30 |
| 1.58 |
| 2.20 |
| 3.00 |
| 3.20 |
| 4.25 |
| 4.85 |
| 5.00 |
| 6.00 |
| 6.00 |
| 8.50 |
| 10.00 |
| 16.17 |
| 18.25 |
| 19.00 |
Here, n = 29
First need to find First quartile and third quartile
First Quartile:
First quartile is
Third quartile:
Third quartile is
Here
(b)
To find the median, first and third quartiles of the Tigers’ salaries.
(b)
Answer to Problem 35E
Median
Explanation of Solution
Given:
The data for Tigers’ salaries is given by
| 23.00 | 21.00 | 20.10 | 13.00 | 9.00 |
| 6.73 | 5.50 | 5.50 | 5.50 | 3.75 |
| 3.10 | 2.10 | 2.10 | 2.10 | 1.10 |
| 1.00 | 0.90 | 0.51 | 0.51 | 0.50 |
| 0.50 | 0.50 | 0.49 | 0.49 | 0.49 |
| 0.48 | 0.48 | 0.48 | 0.48 |
Formula used:
First quartile
If
Third quartile
If
Median is given by
Calculation:
Given data sorted in ascending order:
| x |
| 0.48 |
| 0.48 |
| 0.48 |
| 0.48 |
| 0.49 |
| 0.49 |
| 0.49 |
| 0.50 |
| 0.50 |
| 0.50 |
| 0.51 |
| 0.51 |
| 0.90 |
| 1.00 |
| 1.10 |
| 2.10 |
| 2.10 |
| 3.00 |
| 3.10 |
| 3.75 |
| 5.50 |
| 5.50 |
| 5.50 |
| 6.73 |
| 9.00 |
| 13.00 |
| 20.10 |
| 21.0 |
| 23.00 |
Here, n = 29
First need to find First quartile and third quartile
First Quartile:
First quartile is
Third quartile:
Third quartile is
Here
(c)
To find upper and lower outlier boundaries of Giants’ salaries.
(c)
Answer to Problem 35E
Lower outlier boundary of Giants’ salaries. is
Upper outlier boundary of Giants’ salaries. is
Explanation of Solution
Given:
From part (a)
Formula used:
IQR: Inter
Calculation:
Therefore,
d)
To find upper and lower outlier boundaries of Tigers’ salaries.
d)
Answer to Problem 35E
Lower outlier boundary of Tigers’ salaries. is
Upper outlier boundary of Tigers’ salaries. is
Explanation of Solution
Given:
From part (b)
Formula used:
IQR: Inter Quartile
Calculation:
Therefore,
(e)
To construct a boxplot for Tigers’ salaries and Giants’ salaries and compare.
(e)
Explanation of Solution
Boxplot from given datafor Tigers’ salaries and Giants’ salaries are constructed below.
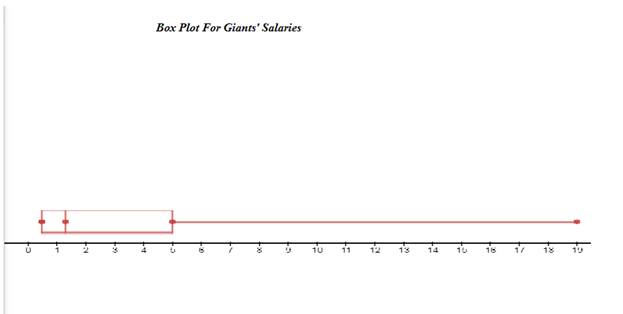
From the above box plot, it can be concluded that 19 is the outlier value which is greater than upper outlier limit.
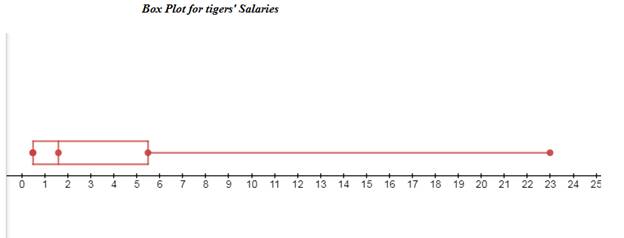
From the above box plot, it can be concluded that 23 is the outlier value which is greater than upper outlier limit.
Want to see more full solutions like this?
Chapter 3 Solutions
Elementary Statistics (Text Only)


- Given your fitted regression line, what would be the residual for snake #5 (10 C)?arrow_forwardCalculate the 95% confidence interval around your estimate of r using Fisher’s z-transformation. In your final answer, make sure to back-transform to the original units.arrow_forwardCalculate Pearson’s correlation coefficient (r) between temperature and heart rate.arrow_forward
- A researcher wishes to estimate, with 90% confidence, the population proportion of adults who support labeling legislation for genetically modified organisms (GMOs). Her estimate must be accurate within 4% of the true proportion. (a) No preliminary estimate is available. Find the minimum sample size needed. (b) Find the minimum sample size needed, using a prior study that found that 65% of the respondents said they support labeling legislation for GMOs. (c) Compare the results from parts (a) and (b). ... (a) What is the minimum sample size needed assuming that no prior information is available? n = (Round up to the nearest whole number as needed.)arrow_forwardThe table available below shows the costs per mile (in cents) for a sample of automobiles. At a = 0.05, can you conclude that at least one mean cost per mile is different from the others? Click on the icon to view the data table. Let Hss, HMS, HLS, Hsuv and Hмy represent the mean costs per mile for small sedans, medium sedans, large sedans, SUV 4WDs, and minivans respectively. What are the hypotheses for this test? OA. Ho: Not all the means are equal. Ha Hss HMS HLS HSUV HMV B. Ho Hss HMS HLS HSUV = μMV Ha: Hss *HMS *HLS*HSUV * HMV C. Ho Hss HMS HLS HSUV =μMV = = H: Not all the means are equal. D. Ho Hss HMS HLS HSUV HMV Ha Hss HMS HLS =HSUV = HMVarrow_forwardQuestion: A company launches two different marketing campaigns to promote the same product in two different regions. After one month, the company collects the sales data (in units sold) from both regions to compare the effectiveness of the campaigns. The company wants to determine whether there is a significant difference in the mean sales between the two regions. Perform a two sample T-test You can provide your answer by inserting a text box and the answer must include: Null hypothesis, Alternative hypothesis, Show answer (output table/summary table), and Conclusion based on the P value. (2 points = 0.5 x 4 Answers) Each of these is worth 0.5 points. However, showing the calculation is must. If calculation is missing, the whole answer won't get any credit.arrow_forward
 Big Ideas Math A Bridge To Success Algebra 1: Stu...AlgebraISBN:9781680331141Author:HOUGHTON MIFFLIN HARCOURTPublisher:Houghton Mifflin Harcourt
 Glencoe Algebra 1, Student Edition, 9780079039897...AlgebraISBN:9780079039897Author:CarterPublisher:McGraw Hill
 Holt Mcdougal Larson Pre-algebra: Student Edition...AlgebraISBN:9780547587776Author:HOLT MCDOUGALPublisher:HOLT MCDOUGAL