
Videos
Electronic devices contain electric circuits etched into wafers made of silicon. These silicon wafers are sealed with an ultrathin layer of silicon dioxide, in a process known as oxidation. This can be done with either new or recycled wafers.
In a study described in the book Statistical Case Studies for Industrial Process Improvement by V. Czitrom and P. Spagon, both new and recycled wafers were oxidized, and the thicknesses of the layers were measured to determine whether they tended to differ between the two types of wafers. Recycled wafers are cheaper than new wafer, so the hope was that they would perform at least as well as the new wafers. Following are 36 thickness measurements (in tenth s of a nanometer) for both new and recycled wafers.
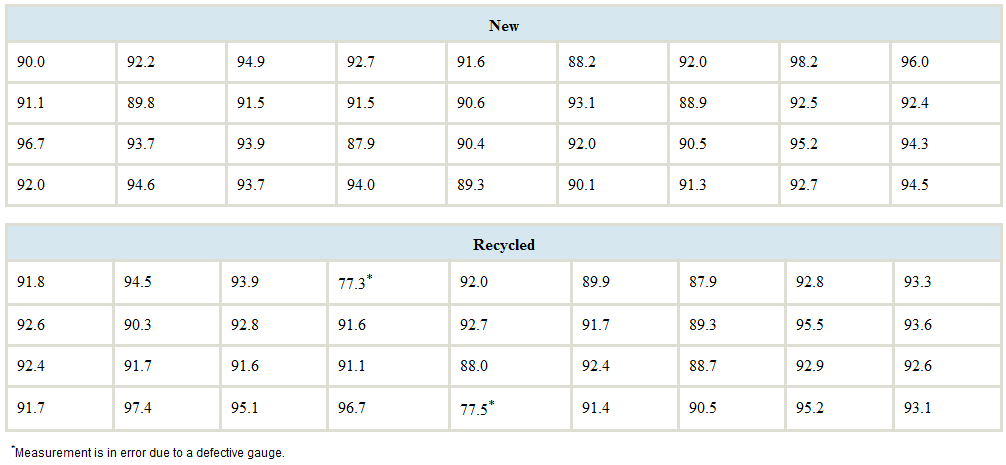
Suppose that it is desired to use the type of wafer whose distribution has less spread. Write a brief paragraph that explains which type of wafer to use and why. Which measure is more useful for spread in this case, the standard deviation or the
Want to see the full answer?
Check out a sample textbook solution
Chapter 3 Solutions
Elementary Statistics (Text Only)


- A company found that the daily sales revenue of its flagship product follows a normal distribution with a mean of $4500 and a standard deviation of $450. The company defines a "high-sales day" that is, any day with sales exceeding $4800. please provide a step by step on how to get the answers Q: What percentage of days can the company expect to have "high-sales days" or sales greater than $4800? Q: What is the sales revenue threshold for the bottom 10% of days? (please note that 10% refers to the probability/area under bell curve towards the lower tail of bell curve) Provide answers in the yellow cellsarrow_forwardBusiness Discussarrow_forwardThe following data represent total ventilation measured in liters of air per minute per square meter of body area for two independent (and randomly chosen) samples. Analyze these data using the appropriate non-parametric hypothesis testarrow_forward
- each column represents before & after measurements on the same individual. Analyze with the appropriate non-parametric hypothesis test for a paired design.arrow_forwardShould you be confident in applying your regression equation to estimate the heart rate of a python at 35°C? Why or why not?arrow_forwardGiven your fitted regression line, what would be the residual for snake #5 (10 C)?arrow_forward
- Calculate the 95% confidence interval around your estimate of r using Fisher’s z-transformation. In your final answer, make sure to back-transform to the original units.arrow_forwardCalculate Pearson’s correlation coefficient (r) between temperature and heart rate.arrow_forwardCalculate the least squares regression line and write the equation.arrow_forward
 MATLAB: An Introduction with ApplicationsStatisticsISBN:9781119256830Author:Amos GilatPublisher:John Wiley & Sons Inc
 Probability and Statistics for Engineering and th...StatisticsISBN:9781305251809Author:Jay L. DevorePublisher:Cengage Learning
 Statistics for The Behavioral Sciences (MindTap C...StatisticsISBN:9781305504912Author:Frederick J Gravetter, Larry B. WallnauPublisher:Cengage Learning
 Elementary Statistics: Picturing the World (7th E...StatisticsISBN:9780134683416Author:Ron Larson, Betsy FarberPublisher:PEARSON
 The Basic Practice of StatisticsStatisticsISBN:9781319042578Author:David S. Moore, William I. Notz, Michael A. FlignerPublisher:W. H. Freeman
 Introduction to the Practice of StatisticsStatisticsISBN:9781319013387Author:David S. Moore, George P. McCabe, Bruce A. CraigPublisher:W. H. Freeman