
Concept explainers
Videos
Hazardous waste: Following is a list of the number of hazardous waste sites in each of the 50 states of the United States in a recent year. The list has been sorted into numerical order.

- Find the first and third
quartiles of these data. - Find the
median of these data. - Find the upper and lower outlier boundaries.
- Are there any outliers? If so, list them.
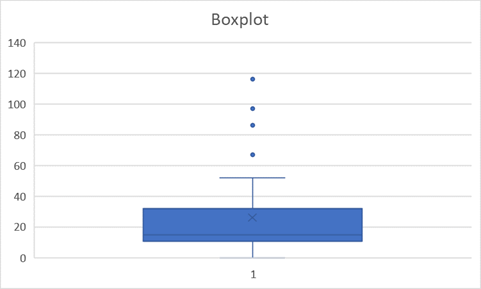
- Construct a boxplot for these data.
- Describe the shape of this distribution.
- What is the 30th percentile?
- What is the 85th percentile?
- The state of Georgia has 16 hazardous waste sites. What percentile is this?
a)
To find the first and third quartiles of the given data.
Answer to Problem 25E
First quartile = 10.5 and third quartile = 32
Explanation of Solution
Formula:
First quartile
Third quartile
Calculation:
Given data sorted in ascending order:
| 0 | 9 | 14 | 20 | 40 |
| 1 | 9 | 14 | 21 | 48 |
| 2 | 11 | 14 | 25 | 49 |
| 2 | 12 | 14 | 26 | 49 |
| 3 | 12 | 15 | 29 | 52 |
| 5 | 12 | 15 | 30 | 67 |
| 6 | 12 | 15 | 32 | 86 |
| 9 | 12 | 16 | 32 | 97 |
| 9 | 13 | 19 | 32 | 97 |
| 9 | 13 | 19 | 38 | 116 |
Here, n = 50
First need to find First quartile and third quartile
First Quartile:
First quartile is 10.5
Third quartile:
Third quartile is 32
b)
To find median of the data.
Answer to Problem 25E
Median is 15
Explanation of Solution
Formula:
Calculation:
c)
To find upper and lower outlier boundaries.
Answer to Problem 25E
Lower outlier boundary is -21.5
Upper outlier boundary is 64.25
Explanation of Solution
Formula:
IQR:
Calculation:
Therefore,
d)
To find the list of outliers.
Answer to Problem 25E
The outlier points are 67,86,97,97,116
Explanation of Solution
Outliers are those values which are less than
Here,
Lower outlier boundary is -21.5
Upper outlier boundary is 64.5
There is no any value less than -21.5. But there are five values larger than 64.5 which are:
67,86,97,97,116
Hence outlier points are 67,86,97,97,116
e)
To construct a boxplot from given data
Explanation of Solution
Boxplot from given data:
f)
To find shape of the distribution
Answer to Problem 25E
The shape of the distribution is positively-skewed.
Explanation of Solution
Here, median is close to first quarter. Hence the shape of the distribution is positively-skewed.
g)
To find 30th percentile
Answer to Problem 25E
30th percentile is 12
Explanation of Solution
Therefore,
h)
To find 85th percentile
Answer to Problem 25E
85th percentile is 49
Explanation of Solution
Therefore,
h)
To find percentile rank of Georgia.
Answer to Problem 25E
Percentile rank of Georgia at 16 is 54%
Explanation of Solution
Formula:
Calculation:
Want to see more full solutions like this?
Chapter 3 Solutions
Elementary Statistics (Text Only)


- A marketing agency wants to determine whether different advertising platforms generate significantly different levels of customer engagement. The agency measures the average number of daily clicks on ads for three platforms: Social Media, Search Engines, and Email Campaigns. The agency collects data on daily clicks for each platform over a 10-day period and wants to test whether there is a statistically significant difference in the mean number of daily clicks among these platforms. Conduct ANOVA test. You can provide your answer by inserting a text box and the answer must include: also please provide a step by on getting the answers in excel Null hypothesis, Alternative hypothesis, Show answer (output table/summary table), and Conclusion based on the P value.arrow_forwardA company found that the daily sales revenue of its flagship product follows a normal distribution with a mean of $4500 and a standard deviation of $450. The company defines a "high-sales day" that is, any day with sales exceeding $4800. please provide a step by step on how to get the answers Q: What percentage of days can the company expect to have "high-sales days" or sales greater than $4800? Q: What is the sales revenue threshold for the bottom 10% of days? (please note that 10% refers to the probability/area under bell curve towards the lower tail of bell curve) Provide answers in the yellow cellsarrow_forwardBusiness Discussarrow_forward
- The following data represent total ventilation measured in liters of air per minute per square meter of body area for two independent (and randomly chosen) samples. Analyze these data using the appropriate non-parametric hypothesis testarrow_forwardeach column represents before & after measurements on the same individual. Analyze with the appropriate non-parametric hypothesis test for a paired design.arrow_forwardShould you be confident in applying your regression equation to estimate the heart rate of a python at 35°C? Why or why not?arrow_forward
 Big Ideas Math A Bridge To Success Algebra 1: Stu...AlgebraISBN:9781680331141Author:HOUGHTON MIFFLIN HARCOURTPublisher:Houghton Mifflin Harcourt
 Glencoe Algebra 1, Student Edition, 9780079039897...AlgebraISBN:9780079039897Author:CarterPublisher:McGraw Hill
 Holt Mcdougal Larson Pre-algebra: Student Edition...AlgebraISBN:9780547587776Author:HOLT MCDOUGALPublisher:HOLT MCDOUGAL