
Concept explainers
Videos
Hazardous waste: Following is a list of the number of hazardous waste sites in each of the 50 states of the United States in a recent year. The list has been sorted into numerical order.

- Find the first and third
quartiles of these data. - Find the
median of these data. - Find the upper and lower outlier boundaries.
- Are there any outliers? If so, list them.
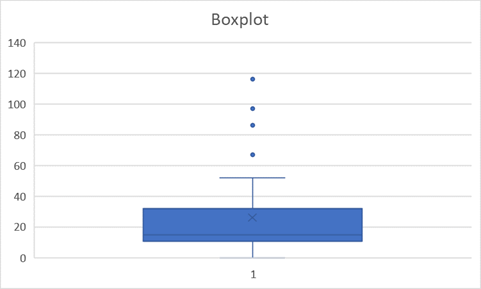
- Construct a boxplot for these data.
- Describe the shape of this distribution.
- What is the 30th percentile?
- What is the 85th percentile?
- The state of Georgia has 16 hazardous waste sites. What percentile is this?
a)
To find the first and third quartiles of the given data.
Answer to Problem 31E
First quartile = 10.5 and third quartile = 32
Explanation of Solution
Formula:
First quartile
Third quartile
Calculation:
Given data sorted in ascending order:
| 0 | 9 | 14 | 20 | 40 |
| 1 | 9 | 14 | 21 | 48 |
| 2 | 11 | 14 | 25 | 49 |
| 2 | 12 | 14 | 26 | 49 |
| 3 | 12 | 15 | 29 | 52 |
| 5 | 12 | 15 | 30 | 67 |
| 6 | 12 | 15 | 32 | 86 |
| 9 | 12 | 16 | 32 | 97 |
| 9 | 13 | 19 | 32 | 97 |
| 9 | 13 | 19 | 38 | 116 |
Here, n = 50
First need to find First quartile and third quartile
First Quartile:
First quartile is 10.5
Third quartile:
Third quartile is 32
b)
To find median of the data.
Answer to Problem 31E
Median is 15
Explanation of Solution
Formula:
Calculation:
c)
To find upper and lower outlier boundaries.
Answer to Problem 31E
Lower outlier boundary is -21.5
Upper outlier boundary is 64.25
Explanation of Solution
Formula:
IQR:
Calculation:
Therefore,
d)
To find the list of outliers.
Answer to Problem 31E
The outlier points are 67,86,97,97,116
Explanation of Solution
Outliers are those values which are less than
Here,
Lower outlier boundary is -21.5
Upper outlier boundary is 64.5
There is no any value less than -21.5. But there are five values larger than 64.5 which are:
67,86,97,97,116
Hence outlier points are 67,86,97,97,116
e)
To construct a boxplot from given data
Explanation of Solution
Boxplot from given data:
f)
To find shape of the distribution
Answer to Problem 31E
The shape of the distribution is positively-skewed.
Explanation of Solution
Here, median is close to first quarter. Hence the shape of the distribution is positively-skewed.
g)
To find 30th percentile
Answer to Problem 31E
30th percentile is 12
Explanation of Solution
Therefore,
h)
To find 85th percentile
Answer to Problem 31E
85th percentile is 49
Explanation of Solution
Therefore,
h)
To find percentile rank of Georgia.
Answer to Problem 31E
Percentile rank of Georgia at 16 is 54%
Explanation of Solution
Formula:
Calculation:
Want to see more full solutions like this?
Chapter 3 Solutions
Elementary Statistics ( 3rd International Edition ) Isbn:9781260092561


- F Make a box plot from the five-number summary: 100, 105, 120, 135, 140. harrow_forward14 Is the standard deviation affected by skewed data? If so, how? foldarrow_forwardFrequency 15 Suppose that your friend believes his gambling partner plays with a loaded die (not fair). He shows you a graph of the outcomes of the games played with this die (see the following figure). Based on this graph, do you agree with this person? Why or why not? 65 Single Die Outcomes: Graph 1 60 55 50 45 40 1 2 3 4 Outcome 55 6arrow_forward
- lie y H 16 The first month's telephone bills for new customers of a certain phone company are shown in the following figure. The histogram showing the bills is misleading, however. Explain why, and suggest a solution. Frequency 140 120 100 80 60 40 20 0 0 20 40 60 80 Telephone Bill ($) 100 120arrow_forward25 ptical rule applies because t Does the empirical rule apply to the data set shown in the following figure? Explain. 2 6 5 Frequency 3 сл 2 1 0 2 4 6 8 00arrow_forward24 Line graphs typically connect the dots that represent the data values over time. If the time increments between the dots are large, explain why the line graph can be somewhat misleading.arrow_forward
- 17 Make a box plot from the five-number summary: 3, 4, 7, 16, 17. 992) waarrow_forward12 10 - 8 6 4 29 0 Interpret the shape, center and spread of the following box plot. brill smo slob.nl bagharrow_forwardSuppose that a driver's test has a mean score of 7 (out of 10 points) and standard deviation 0.5. a. Explain why you can reasonably assume that the data set of the test scores is mound-shaped. b. For the drivers taking this particular test, where should 68 percent of them score? c. Where should 95 percent of them score? d. Where should 99.7 percent of them score? Sarrow_forward
- 13 Can the mean of a data set be higher than most of the values in the set? If so, how? Can the median of a set be higher than most of the values? If so, how? srit to estaarrow_forwardA random variable X takes values 0 and 1 with probabilities q and p, respectively, with q+p=1. find the moment generating function of X and show that all the moments about the origin equal p. (Note- Please include as much detailed solution/steps in the solution to understand, Thank you!)arrow_forward1 (Expected Shortfall) Suppose the price of an asset Pt follows a normal random walk, i.e., Pt = Po+r₁ + ... + rt with r₁, r2,... being IID N(μ, o²). Po+r1+. ⚫ Suppose the VaR of rt is VaRq(rt) at level q, find the VaR of the price in T days, i.e., VaRq(Pt – Pt–T). - • If ESq(rt) = A, find ES₁(Pt – Pt–T).arrow_forward
 Big Ideas Math A Bridge To Success Algebra 1: Stu...AlgebraISBN:9781680331141Author:HOUGHTON MIFFLIN HARCOURTPublisher:Houghton Mifflin Harcourt
 Glencoe Algebra 1, Student Edition, 9780079039897...AlgebraISBN:9780079039897Author:CarterPublisher:McGraw Hill
 Holt Mcdougal Larson Pre-algebra: Student Edition...AlgebraISBN:9780547587776Author:HOLT MCDOUGALPublisher:HOLT MCDOUGAL