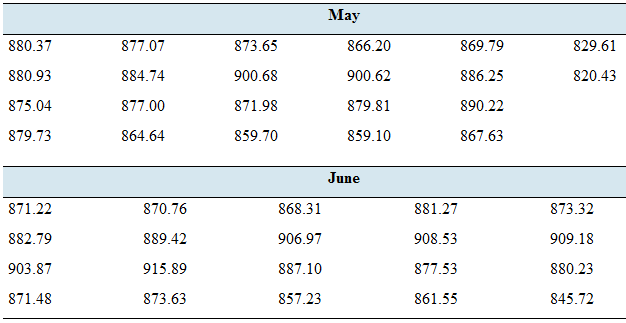
Stock prices: Following are the closing prices of Google stock for each trading day in May and June of a recent year.

- Find the population standard deviation for the prices in May.
- Find the population standard deviation for the prices in June.
- Financial analysts use the word volatility to refer to the variation in prices of assets such as stocks. In which month was the price of Google stock more volatile?
a)
To find the Population standard deviation for prices in May.
Answer to Problem 41E
Standard Deviation = 18.53
Explanation of Solution
Given:
The data
| May (Xi) | June (Yi) |
| 880.37 | 871.22 |
| 877.07 | 870.76 |
| 873.65 | 868.31 |
| 866.2 | 881.27 |
| 869.79 | 873.32 |
| 829.61 | 882.79 |
| 880.93 | 889.42 |
| 884.74 | 906.97 |
| 900.68 | 908.53 |
| 900.62 | 909.18 |
| 886.25 | 903.87 |
| 820.43 | 915.89 |
| 875.04 | 887.1 |
| 877 | 877.53 |
| 871.98 | 880.23 |
| 879.81 | 871.48 |
| 890.22 | 873.63 |
| 879.73 | 857.23 |
| 864.64 | 861.55 |
| 859.7 | 845.72 |
| 859.1 | |
| 867.63 |
Calculation:
| May (Xi) | ||
| 880.37 | 61.80 | |
| 877.07 | 20.81 | |
| 873.65 | 1.30 | |
| 866.2 | 39.80 | |
| 869.79 | 7.39 | |
| 829.61 | 1840.29 | |
| 880.93 | 70.92 | |
| 884.74 | 149.61 | |
| 900.68 | 793.63 | |
| 900.62 | 790.25 | |
| 886.25 | 188.83 | |
| 820.43 | 2712.18 | |
| 875.04 | 6.41 | |
| 877 | 20.17 | |
| 871.98 | 0.28 | |
| 879.81 | 53.31 | |
| 890.22 | 313.69 | |
| 879.73 | 52.15 | |
| 864.64 | 61.92 | |
| 859.7 | 164.06 | |
| 859.1 | 179.79 | |
| 867.63 | 23.80 | |
| SUM | 19195.19 | 7552.38 |
| Mean | 872.51 | |
| Standard Deviation | 18.96 |
The mean and standard deviation for 2015 is 872.51 and 18.53.
b)
To find the Population standard deviation for June.
Answer to Problem 41E
Standard Deviation = 164.65
Explanation of Solution
Calculation:
| June (Yi) | ||
| 871.22 | 111.94 | |
| 870.76 | 121.88 | |
| 868.31 | 181.98 | |
| 881.27 | 0.28 | |
| 873.32 | 71.91 | |
| 882.79 | 0.98 | |
| 889.42 | 58.06 | |
| 906.97 | 633.53 | |
| 908.53 | 714.49 | |
| 909.18 | 749.66 | |
| 903.87 | 487.08 | |
| 915.89 | 1162.13 | |
| 887.1 | 28.09 | |
| 877.53 | 18.23 | |
| 880.23 | 2.46 | |
| 871.48 | 106.50 | |
| 873.63 | 66.75 | |
| 857.23 | 603.68 | |
| 861.55 | 410.06 | |
| 845.72 | 1301.77 | |
| SUM | 17636.00 | 6831.49 |
| Mean | 881.80 | |
| Standard Deviation | 18.96 |
The mean and standard deviation of sports model is 881.8 and 18.48.
c)
To identify the month in which Google’s stock price are more volatile.
Answer to Problem 41E
May
Explanation of Solution
As the standard deviation in May is 18.53 and in June it is 18.48, it shows that May has higher standard deviation as compared to may, which shows that May is more volatile as compared to the June.
Want to see more full solutions like this?
Chapter 3 Solutions
Elementary Statistics ( 3rd International Edition ) Isbn:9781260092561
- (c) Describe the positive and negative parts of a random variable. How is the integral defined for a general random variable using these components?arrow_forward26. (a) Provide an example where X, X but E(X,) does not converge to E(X).arrow_forward(b) Demonstrate that if X and Y are independent, then it follows that E(XY) E(X)E(Y);arrow_forward
- (d) Under what conditions do we say that a random variable X is integrable, specifically when (i) X is a non-negative random variable and (ii) when X is a general random variable?arrow_forward29. State the Borel-Cantelli Lemmas without proof. What is the primary distinction between Lemma 1 and Lemma 2?arrow_forward(c) Explain the Dominated Convergence Theorem (DCT) without providing a proof.arrow_forward
 Big Ideas Math A Bridge To Success Algebra 1: Stu...AlgebraISBN:9781680331141Author:HOUGHTON MIFFLIN HARCOURTPublisher:Houghton Mifflin Harcourt
 Glencoe Algebra 1, Student Edition, 9780079039897...AlgebraISBN:9780079039897Author:CarterPublisher:McGraw Hill
 Holt Mcdougal Larson Pre-algebra: Student Edition...AlgebraISBN:9780547587776Author:HOLT MCDOUGALPublisher:HOLT MCDOUGAL
 College Algebra (MindTap Course List)AlgebraISBN:9781305652231Author:R. David Gustafson, Jeff HughesPublisher:Cengage Learning


