
Elementary Statistics ( 3rd International Edition ) Isbn:9781260092561
3rd Edition
ISBN: 9781259969454
Author: William Navidi Prof.; Barry Monk Professor
Publisher: McGraw-Hill Education
expand_more
expand_more
format_list_bulleted
Concept explainers
Videos
Textbook Question
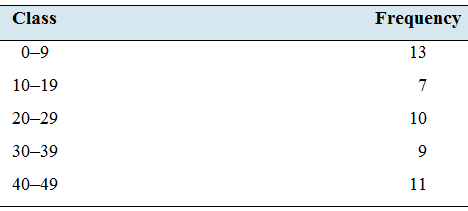
Chapter 3.2, Problem 25E
Approximate the sample variance and standard deviation given the following frequency distribution:
Expert Solution & Answer
Want to see the full answer?
Check out a sample textbook solution
Students have asked these similar questions
Are there any unusually high or low pH levels in this sample of wells?
0
n
AM
RIES
s of
of
10
m
Frequency
40
Frequency
20
20
30
10
You make two histograms from two different
data sets (see the following figures), each
one containing 200 observations. Which of
the histograms has a smaller spread: the first
or the second?
40
30
20
10
0
20
40
60
0
20
20
40
60
60
80
80
100
80
100
TIP
the
aren't, the data are not sym
11
Suppose that the average salary at a certain
company is $100,000, and the median salary
is $40,000.
a. What do these figures tell you about the
shape of the histogram of salaries at this
company?
b. Which measure of center is more appro-
priate here?
c. Suppose that the company goes through a
salary negotiation. How can people on
each side use these summary statistics to
their advantage?
6360 be
52
PART 1 Getting Off to a Statistically Significant S
Chapter 3 Solutions
Elementary Statistics ( 3rd International Edition ) Isbn:9781260092561
Ch. 3.1 - In Exercises 9—12, fill in each blank with the...Ch. 3.1 - In Exercises 9—12, fill in each blank with the...Ch. 3.1 - In Exercises 9—12, fill in each blank with the...Ch. 3.1 - In Exercises 9—12, fill in each blank with the...Ch. 3.1 - In Exercises 13—16, determine whether the...Ch. 3.1 - In Exercises 13—16, determine whether the...Ch. 3.1 - In Exercises 13—16, determine whether the...Ch. 3.1 - In Exercises 13—16, determine whether the...Ch. 3.1 - Find the mean, median, and mode for the following...Ch. 3.1 - Find the mean, median, and mode for the following...
Ch. 3.1 - Find the mean, median, and mode for the following...Ch. 3.1 - Find the mean, median, and mode for the following...Ch. 3.1 - In Exercises 21—24, use the given frequency...Ch. 3.1 - In Exercises 21—24, use the given frequency...Ch. 3.1 - In Exercises 21—24, use the given frequency...Ch. 3.1 - In Exercises 21—24, use the given frequency...Ch. 3.1 - Use the properties of the mean and median to...Ch. 3.1 - Use the properties of the mean and median to...Ch. 3.1 - Use the properties of the mean and median to...Ch. 3.1 - Use the properties of the mean and median to...Ch. 3.1 - Find the mean, median, and mode of the data in the...Ch. 3.1 - Find the mean, median, and mode of the data in the...Ch. 3.1 - Facebook friends: In a study of Facebook users...Ch. 3.1 - Mean and median height: The National Center for...Ch. 3.1 - Life expectancy: According to the National Vital...Ch. 3.1 - Prob. 34ECh. 3.1 - Hamburgers: An ABC News story reported the number...Ch. 3.1 - Great swimmer: In the 2016 Olympic Games, Michael...Ch. 3.1 - Mobile apps: The following table presents the...Ch. 3.1 - Prob. 38ECh. 3.1 - Whats your favorite TV show? The following tables...Ch. 3.1 - Prob. 40ECh. 3.1 - Gas prices: The following table presents the...Ch. 3.1 - Prob. 42ECh. 3.1 - Heavy football players: Following are the weights,...Ch. 3.1 - Prob. 44ECh. 3.1 - Flu season: The following tables present the...Ch. 3.1 - News flash: The following table presents the...Ch. 3.1 - Commercial break: Following are the amounts spent...Ch. 3.1 - Prob. 48ECh. 3.1 - Dont drink and drive: The Insurance Institute for...Ch. 3.1 - Prob. 50ECh. 3.1 - Be my Valentine: The following frequency...Ch. 3.1 - Get your degree: The following frequency...Ch. 3.1 - Prob. 53ECh. 3.1 - Take in a show: The following table presents the...Ch. 3.1 - Prob. 55ECh. 3.1 - Sources of news: A sample of 32 U.S. adults was...Ch. 3.1 - Find the mean: The National Center for Health...Ch. 3.1 - Find the median: According to a recent Current...Ch. 3.1 - Find the median: In a recent year, approximately...Ch. 3.1 - Find the median: The National Health and Nutrition...Ch. 3.1 - Heights: There are 2500 women and 2000 men...Ch. 3.1 - Prob. 62ECh. 3.1 - Heights: There are 35 students in a class. Fifteen...Ch. 3.1 - Prob. 64ECh. 3.1 - Prob. 65ECh. 3.1 - Prob. 66ECh. 3.1 - Whats the score? Jermaine has entered a bowling...Ch. 3.1 - Whats your grade? Addison has been told that her...Ch. 3.1 - Weighted mean: Rachel worked at three part-time...Ch. 3.1 - Weighted mean: In Jacobs statistics class, the...Ch. 3.1 - Mean or median? The Smith family in Example 3.5...Ch. 3.1 - Prob. 72ECh. 3.1 - Prob. 73ECh. 3.1 - Prob. 74ECh. 3.1 - Prob. 75ECh. 3.1 - Prob. 76ECh. 3.1 - Prob. 77ECh. 3.1 - Prob. 78ECh. 3.1 - Prob. 79ECh. 3.1 - Prob. 80ECh. 3.1 - Prob. 81ECh. 3.1 - Prob. 82ECh. 3.2 - In Exercises 11—14, fill in each blank with the...Ch. 3.2 - In Exercises 11—14, fill in each blank with the...Ch. 3.2 - In Exercises 11—14, fill in each blank with the...Ch. 3.2 - In Exercises 11—14, fill in each blank with the...Ch. 3.2 - In Exercises 15—18, determine whether the...Ch. 3.2 - In Exercises 15—18, determine whether the...Ch. 3.2 - In Exercises 15—18, determine whether the...Ch. 3.2 - In Exercises 15—18, determine whether the...Ch. 3.2 - Find the sample variance and standard deviation...Ch. 3.2 - Find the sample variance and standard deviation...Ch. 3.2 - Find the sample variance and standard deviation...Ch. 3.2 - Find the population variance and standard...Ch. 3.2 - Find the population variance and standard...Ch. 3.2 - Find the population variance and standard...Ch. 3.2 - Approximate the sample variance and standard...Ch. 3.2 - Approximate the sample variance and standard...Ch. 3.2 - Approximate the population variance and standard...Ch. 3.2 - Approximate the population variance and standard...Ch. 3.2 - Distances of the eight planets from the sun, in...Ch. 3.2 - A survey was taken in which people were asked how...Ch. 3.2 - The following TI-84 Plus display presents some...Ch. 3.2 - The following TI-84 Plus display presents some...Ch. 3.2 - The following TI-84 Plus display presents some...Ch. 3.2 - The following TI-84 Plus display presents some...Ch. 3.2 - Amazon: The following table presents the retail...Ch. 3.2 - Sports car or convertible? The following table...Ch. 3.2 - Heavy football players: Following are the weights,...Ch. 3.2 - Beer: The following table presents the number of...Ch. 3.2 - Whats your favorite TV show? The following tables...Ch. 3.2 - House prices: The following table presents prices,...Ch. 3.2 - Stock prices: Following are the closing prices of...Ch. 3.2 - Prob. 42ECh. 3.2 - Time to review: The following table presents the...Ch. 3.2 - Age distribution: The ages of residents of Banks...Ch. 3.2 - Lunch break: In a recent survey of 655 working...Ch. 3.2 - Pay your bills: In a large sample of customer...Ch. 3.2 - Newborn babies: A study conducted by the Center...Ch. 3.2 - Internet providers: In a survey of 600 homeowners...Ch. 3.2 - Lunch break: For the data in Exercise 45, estimate...Ch. 3.2 - Pay your bills: For the data in Exercise 46,...Ch. 3.2 - Newborn babies: For the data in Exercise 47,...Ch. 3.2 - Internet providers: For the data in Exercise 48,...Ch. 3.2 - Prob. 53ECh. 3.2 - Empirical Rule OK? The following histogram...Ch. 3.2 - Empirical Rule OK? The following histogram...Ch. 3.2 - Empirical Rule OK? The following histogram...Ch. 3.2 - Whats the temperature? The temperature in a...Ch. 3.2 - Find the standard deviation: The National Center...Ch. 3.2 - Find the standard deviation: The National Center...Ch. 3.2 - Price of electricity: The Energy Information...Ch. 3.2 - Possible or impossible? A data set has a mean of...Ch. 3.2 - Possible or impossible? A data set has a mean of...Ch. 3.2 - Prob. 63ECh. 3.2 - Prob. 64ECh. 3.2 - Height and weight: A Naona1 Center for Health...Ch. 3.2 - Test scores: Scores on a statistics exam had a...Ch. 3.2 - Mean absolute deviation: A measure of spread that...Ch. 3.2 - Prob. 68ECh. 3.3 - In Exercises 9—12, fill in each blank with the...Ch. 3.3 - In Exercises 9—12, fill in each blank with the...Ch. 3.3 - In Exercises 9—12, fill in each blank with the...Ch. 3.3 - In Exercises 9—12, fill in each blank with the...Ch. 3.3 - In Exercises 13—16, determine whether the...Ch. 3.3 - In Exercises 13—16, determine whether the...Ch. 3.3 - In Exercises 13—16, determine whether the...Ch. 3.3 - In Exercises 13—16, determine whether the...Ch. 3.3 - A popu1aon has mean =7 and standard deviation =2....Ch. 3.3 - A population has mean =25 and standard deviation...Ch. 3.3 - In Exercises 19 and 20, identify the outlier. Then...Ch. 3.3 - Prob. 20ECh. 3.3 - For the data set 37 82 20 25 31 10 41 44 4 36 68...Ch. 3.3 - For the data set Find the first and third...Ch. 3.3 - For the data set Find the 58th percentile. Find...Ch. 3.3 - For the data set Find the 80th percentile. Find...Ch. 3.3 - The following TI-84 Plus display presents the...Ch. 3.3 - Prob. 26ECh. 3.3 - Standardized tests: In a recent year, the mean...Ch. 3.3 - A fish story: The mean length of one-year-old...Ch. 3.3 - Blood pressure in men: The three quartiles for...Ch. 3.3 - Blood pressure in women: The article referred to...Ch. 3.3 - Hazardous waste: Following is a list of the number...Ch. 3.3 - Cholesterol levels: The National Health and...Ch. 3.3 - Commuting to work: Jamie drives to work every...Ch. 3.3 - Windy city by the bay: Following are wind speeds...Ch. 3.3 - Caffeine: Following are the number of grams of...Ch. 3.3 - Prob. 36ECh. 3.3 - Place your bets: In a recent year, 28 states in...Ch. 3.3 - Prob. 38ECh. 3.3 - Prob. 39ECh. 3.3 - Prob. 40ECh. 3.3 - Bragging rights: After learning his score on a...Ch. 3.3 - Who scored the highest? On a final exam in a large...Ch. 3.3 - Baseball salaries: In 2016, the Chicago Cubs...Ch. 3.3 - Prob. 44ECh. 3.3 - Prob. 45ECh. 3.3 - Prob. 46ECh. 3.3 - Prob. 47ECh. 3.3 - Boxplot possible? Following is the five-number...Ch. 3.3 - Unusual boxplot: Ten residents of a town were...Ch. 3.3 - Prob. 50ECh. 3.3 - Highly skewed data: Make up a data set in which...Ch. 3.3 - Highly skewed data: Make up a data set in which...Ch. 3.3 - Prob. 53ECh. 3.3 - Prob. 54ECh. 3.3 - z-scores and skewed data: Table 3.9 presents the...Ch. 3 - Of the mean, median and mode, which must be a...Ch. 3 - The prices (in dollars) for a sample of personal...Ch. 3 - Prob. 3CQCh. 3 - Prob. 4CQCh. 3 - Prob. 5CQCh. 3 - Prob. 6CQCh. 3 - Each of the following histograms represents a data...Ch. 3 - In Exercises 8—11, suppose that the mean...Ch. 3 - Prob. 9CQCh. 3 - In Exercises 8—11, suppose that the mean...Ch. 3 - Prob. 11CQCh. 3 - Prob. 12CQCh. 3 - Prob. 13CQCh. 3 - Prob. 14CQCh. 3 - Prob. 15CQCh. 3 - Prob. 1RECh. 3 - Prob. 2RECh. 3 - Prob. 3RECh. 3 - Prob. 4RECh. 3 - Prob. 5RECh. 3 - Prob. 6RECh. 3 - Measure that ball: Each of 16 students measured...Ch. 3 - Prob. 8RECh. 3 - Rivets: A machine makes rivets that are used in...Ch. 3 - Prob. 10RECh. 3 - Prob. 11RECh. 3 - Advertising costs: The amounts spent (in billions)...Ch. 3 - Prob. 13RECh. 3 - Prob. 14RECh. 3 - Prob. 15RECh. 3 - The U.S. Department of Labor annually publishes an...Ch. 3 - Explain why the Empirical Rule is more useful than...Ch. 3 - Prob. 3WAICh. 3 - Prob. 4WAICh. 3 - Percentiles are values that divide a data set into...Ch. 3 - Prob. 1CSCh. 3 - Prob. 2CSCh. 3 - Prob. 3CSCh. 3 - Prob. 4CSCh. 3 - Prob. 5CSCh. 3 - Prob. 6CSCh. 3 - Prob. 7CSCh. 3 - Prob. 8CSCh. 3 - Electronic devices contain electric circuits...
Knowledge Booster


Learn more about
Need a deep-dive on the concept behind this application? Look no further. Learn more about this topic, statistics and related others by exploring similar questions and additional content below.Similar questions
- 12 Suppose that you know that a data set is skewed left, and you know that the two measures of center are 19 and 38. Which figure is the mean and which is the median?arrow_forwardy of 45 home- televisions u find that 010020 le own one, ee, and 1 owns y histogram of 4 Suppose that you have a loaded die. You roll it several times and record the outcomes, which are shown in the following figure. Histogram for Loaded Die 444% 34.00 48% 6% 2% Frequency 20 20 15 155 10 5- ம 0 1 2 3 4 Outcome 5 6 a. Make a relative frequency histogram of these results. b. You can make a relative frequency histo- gram from a frequency histogram; can you go the other direction?arrow_forwardCalculate the mean for Study Hours and Test Scores. Compute the covariance between the two variables using the formula: Calculate the standard deviation for Study Hours (X) and Test Scores (Y). Determine the correlation coefficient Interpret the results: What does the calculated r-value indicate about the relationship between study hours and test scores?arrow_forward
- For unemployed persons in the United States, the average number of months of unemployment at the end of December 2009 was approximately seven months (Bureau of Labor Statistics, January 2010). Suppose the following data are for a particular region in upstate New York. The values in the first column show the number of months unemployed and the values in the second column show the corresponding number of unemployed persons. Months Unemployed Number Unemployed 1 1029 2 1686 3 2269 4 2675 5 3487 6 4652 7 4145 8 3587 9 2325 10 1120 Let x be a random variable indicating the number of months a person is unemployed. a. Use the data to develop an empirical discrete probability distribution for x (to 4 decimals). (x) f(x) 1 2 3 4 5 6 7 8 9 10 b. Show that your probability distribution satisfies the conditions for a valid discrete probability distribution. The input in the box below will not be graded, but may be reviewed and considered by your instructor. blank c. What is the probability that a…arrow_forwardWest Virginia has one of the highest divorce rates in the nation, with an annual rate of approximately 5 divorces per 1000 people (Centers for Disease Control and Prevention website, January 12, 2012). The Marital Counseling Center, Inc. (MCC) thinks that the high divorce rate in the state may require them to hire additional staff. Working with a consultant, the management of MCC has developed the following probability distribution for x = the number of new clients for marriage counseling for the next year. Excel File: data05-19.xls x 10 f(x) .05 20 30 .10 .10 40 .20 50 60 .35 .20 a. Is this probability distribution valid? - Select your answer- Explain. f(x) Σf(x) Select your answer Select your answer b. What is the probability MCC will obtain more than 30 new clients (to 2 decimals)? c. What is the probability MCC will obtain fewer than 20 new clients (to 2 decimals)? d. Compute the expected value and variance of x. Expected value Variance clients per year squared clients per yeararrow_forwardFor unemployed persons in the United States, the average number of months of unemployment at the end of December 2009 was approximately seven months (Bureau of Labor Statistics, January 2010). Suppose the following data are for a particular region in upstate New York. The values in the first column show the number of months unemployed and the values in the second column show the corresponding number of unemployed persons. Months Unemployed Number Unemployed 1 1029 2 1686 3 2269 4 2675 5 3487 6 4652 7 4145 8 3587 9 2325 10 1120 Let x be a random variable indicating the number of months a person is unemployed. a. Use the data to develop an empirical discrete probability distribution for x (to 4 decimals). (x) f(x) 1 2 3 4 5 6 7 8 9 10 b. Show that your probability distribution satisfies the conditions for a valid discrete probability distribution. The input in the box below will not be graded, but may be reviewed and considered by your instructor. c. What is the probability that a person…arrow_forward
- In Gallup's Annual Consumption Habits Poll, telephone interviews were conducted for a random sample of 1014 adults aged 18 and over. One of the questions was "How many cups of coffee, if any, do you drink on an average day?" The following table shows the results obtained (Gallup website, August 6, 2012). Excel File: data05-23.xls Number of Cups per Day Number of Responses 0 365 264 193 3 4 or more 91 101 Define a random variable x = number of cups of coffee consumed on an average day. Let x = 4 represent four or more cups. Round your answers to four decimal places. a. Develop a probability distribution for x. x 0 1 2 3 4 f(x) b. Compute the expected value of x. cups of coffee c. Compute the variance of x. cups of coffee squared d. Suppose we are only interested in adults that drink at least one cup of coffee on an average day. For this group, let y = the number of cups of coffee consumed on an average day. Compute the expected value of y. Compare it to the expected value of x. The…arrow_forwardIn Gallup's Annual Consumption Habits Poll, telephone interviews were conducted for a random sample of 1014 adults aged 18 and over. One of the questions was "How many cups of coffee, if any, do you drink on an average day?" The following table shows the results obtained (Gallup website, August 6, 2012). Excel File: data05-23.xls Number of Cups per Day Number of Responses 0 365 264 193 2 3 4 or more 91 101 Define a random variable x = number of cups of coffee consumed on an average day. Let x = 4 represent four or more cups. Round your answers to four decimal places. a. Develop a probability distribution for x. x 0 1 2 3 f(x) b. Compute the expected value of x. cups of coffee c. Compute the variance of x. cups of coffee squared d. Suppose we are only interested in adults that drink at least one cup of coffee on an average day. For this group, let y = the number of cups of coffee consumed on an average day. Compute the expected value of y. Compare it to the expected value of x. The…arrow_forwardA technician services mailing machines at companies in the Phoenix area. Depending on the type of malfunction, the service call can take 1, 2, 3, or 4 hours. The different types of malfunctions occur at about the same frequency. Develop a probability distribution for the duration of a service call. Duration of Call x f(x) 1 2 3 4 Which of the following probability distribution graphs accurately represents the data set? Consider the required conditions for a discrete probability function, shown below.Does this probability distribution satisfy equation (5.1)?Does this probability distribution satisfy equation (5.2)? What is the probability a service call will take three hours? A service call has just come in, but the type of malfunction is unknown. It is 3:00 P.M. and service technicians usually get off at 5:00 P.M. What is the probability the service technician will have to work overtime to fix the machine today?arrow_forward
- A psychologist determined that the number of sessions required to obtain the trust of a new patient is either 1, 2, or 3. Let x be a random variable indicating the number of sessions required to gain the patient's trust. The following probability function has been proposed. x f(x) for x = 1, 2, or 3 a. Consider the required conditions for a discrete probability function, shown below. f(x) ≥0 Σf(x) = 1 (5.1) (5.2) Does this probability distribution satisfy equation (5.1)? Select Does this probability distribution satisfy equation (5.2)? Select b. What is the probability that it takes exactly 2 sessions to gain the patient's trust (to 3 decimals)? c. What is the probability that it takes at least 2 sessions to gain the patient's trust (to 3 decimals)?arrow_forwardA technician services mailing machines at companies in the Phoenix area. Depending on the type of malfunction, the service call can take 1, 2, 3, or 4 hours. The different types of malfunctions occur at about the same frequency. Develop a probability distribution for the duration of a service call. Which of the following probability distribution graphs accurately represents the data set? Consider the required conditions for a discrete probability function, shown below.Does this probability distribution satisfy equation (5.1)?Does this probability distribution satisfy equation (5.2)? What is the probability a service call will take three hours? A service call has just come in, but the type of malfunction is unknown. It is 3:00 P.M. and service technicians usually get off at 5:00 P.M. What is the probability the service technician will have to work overtime to fix the machine today?arrow_forwardWest Virginia has one of the highest divorce rates in the nation, with an annual rate of approximately 5 divorces per 1000 people (Centers for Disease Control and Prevention website, January 12, 2012). The Marital Counseling Center, Inc. (MCC) thinks that the high divorce rate in the state may require them to hire additional staff. Working with a consultant, the management of MCC has developed the following probability distribution for x = the number of new clients for marriage counseling for the next year. Excel File: data05-19.xls 10 20 f(x) .05 .10 11 30 40 50 60 .10 .20 .35 .20 a. Is this probability distribution valid? Yes Explain. greater than or equal to 0 f(x) Σf(x) equal to 1 b. What is the probability MCC will obtain more than 30 new clients (to 2 decimals)? c. What is the probability MCC will obtain fewer than 20 new clients (to 2 decimals)? d. Compute the expected value and variance of x. Expected value Variance clients per year squared clients per yeararrow_forward
arrow_back_ios
SEE MORE QUESTIONS
arrow_forward_ios
Recommended textbooks for you
 Glencoe Algebra 1, Student Edition, 9780079039897...AlgebraISBN:9780079039897Author:CarterPublisher:McGraw Hill
 Big Ideas Math A Bridge To Success Algebra 1: Stu...AlgebraISBN:9781680331141Author:HOUGHTON MIFFLIN HARCOURTPublisher:Houghton Mifflin Harcourt
Glencoe Algebra 1, Student Edition, 9780079039897...
Algebra
ISBN:9780079039897
Author:Carter
Publisher:McGraw Hill
Big Ideas Math A Bridge To Success Algebra 1: Stu...
Algebra
ISBN:9781680331141
Author:HOUGHTON MIFFLIN HARCOURT
Publisher:Houghton Mifflin Harcourt
The Shape of Data: Distributions: Crash Course Statistics #7; Author: CrashCourse;https://www.youtube.com/watch?v=bPFNxD3Yg6U;License: Standard YouTube License, CC-BY
Shape, Center, and Spread - Module 20.2 (Part 1); Author: Mrmathblog;https://www.youtube.com/watch?v=COaid7O_Gag;License: Standard YouTube License, CC-BY
Shape, Center and Spread; Author: Emily Murdock;https://www.youtube.com/watch?v=_YyW0DSCzpM;License: Standard Youtube License