
Elementary Statistics ( 3rd International Edition ) Isbn:9781260092561
3rd Edition
ISBN: 9781259969454
Author: William Navidi Prof.; Barry Monk Professor
Publisher: McGraw-Hill Education
expand_more
expand_more
format_list_bulleted
Concept explainers
Videos
Textbook Question
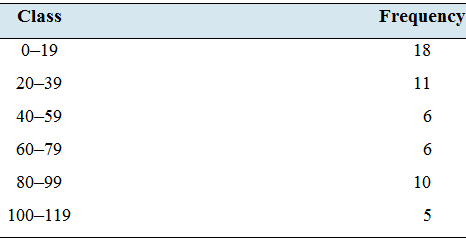
Chapter 3.2, Problem 28E
Approximate the population variance and standard deviation given the following frequency distribution:
Expert Solution & Answer
Want to see the full answer?
Check out a sample textbook solution
Students have asked these similar questions
The average miles per gallon for a sample of 40 cars of model SX last year was 32.1, with a population standard deviation of 3.8. A sample of 40 cars from this year’s model SX has an average of 35.2 mpg, with a population standard deviation of 5.4.
Find a 99 percent confidence interval for the difference in average mpg for this car brand (this year’s model minus last year’s).Find a 99 percent confidence interval for the difference in average mpg for last year’s model minus this year’s. What does the negative difference mean?
A special interest group reports a tiny margin of error (plus or minus 0.04 percent) for its online survey based on 50,000 responses. Is the margin of error legitimate? (Assume that the group’s math is correct.)
Suppose that 73 percent of a sample of 1,000 U.S. college students drive a used car as opposed to a new car or no car at all.
Find an 80 percent confidence interval for the percentage of all U.S. college students who drive a used car.What sample size would cut this margin of error in half?
Chapter 3 Solutions
Elementary Statistics ( 3rd International Edition ) Isbn:9781260092561
Ch. 3.1 - In Exercises 9—12, fill in each blank with the...Ch. 3.1 - In Exercises 9—12, fill in each blank with the...Ch. 3.1 - In Exercises 9—12, fill in each blank with the...Ch. 3.1 - In Exercises 9—12, fill in each blank with the...Ch. 3.1 - In Exercises 13—16, determine whether the...Ch. 3.1 - In Exercises 13—16, determine whether the...Ch. 3.1 - In Exercises 13—16, determine whether the...Ch. 3.1 - In Exercises 13—16, determine whether the...Ch. 3.1 - Find the mean, median, and mode for the following...Ch. 3.1 - Find the mean, median, and mode for the following...
Ch. 3.1 - Find the mean, median, and mode for the following...Ch. 3.1 - Find the mean, median, and mode for the following...Ch. 3.1 - In Exercises 21—24, use the given frequency...Ch. 3.1 - In Exercises 21—24, use the given frequency...Ch. 3.1 - In Exercises 21—24, use the given frequency...Ch. 3.1 - In Exercises 21—24, use the given frequency...Ch. 3.1 - Use the properties of the mean and median to...Ch. 3.1 - Use the properties of the mean and median to...Ch. 3.1 - Use the properties of the mean and median to...Ch. 3.1 - Use the properties of the mean and median to...Ch. 3.1 - Find the mean, median, and mode of the data in the...Ch. 3.1 - Find the mean, median, and mode of the data in the...Ch. 3.1 - Facebook friends: In a study of Facebook users...Ch. 3.1 - Mean and median height: The National Center for...Ch. 3.1 - Life expectancy: According to the National Vital...Ch. 3.1 - Prob. 34ECh. 3.1 - Hamburgers: An ABC News story reported the number...Ch. 3.1 - Great swimmer: In the 2016 Olympic Games, Michael...Ch. 3.1 - Mobile apps: The following table presents the...Ch. 3.1 - Prob. 38ECh. 3.1 - Whats your favorite TV show? The following tables...Ch. 3.1 - Prob. 40ECh. 3.1 - Gas prices: The following table presents the...Ch. 3.1 - Prob. 42ECh. 3.1 - Heavy football players: Following are the weights,...Ch. 3.1 - Prob. 44ECh. 3.1 - Flu season: The following tables present the...Ch. 3.1 - News flash: The following table presents the...Ch. 3.1 - Commercial break: Following are the amounts spent...Ch. 3.1 - Prob. 48ECh. 3.1 - Dont drink and drive: The Insurance Institute for...Ch. 3.1 - Prob. 50ECh. 3.1 - Be my Valentine: The following frequency...Ch. 3.1 - Get your degree: The following frequency...Ch. 3.1 - Prob. 53ECh. 3.1 - Take in a show: The following table presents the...Ch. 3.1 - Prob. 55ECh. 3.1 - Sources of news: A sample of 32 U.S. adults was...Ch. 3.1 - Find the mean: The National Center for Health...Ch. 3.1 - Find the median: According to a recent Current...Ch. 3.1 - Find the median: In a recent year, approximately...Ch. 3.1 - Find the median: The National Health and Nutrition...Ch. 3.1 - Heights: There are 2500 women and 2000 men...Ch. 3.1 - Prob. 62ECh. 3.1 - Heights: There are 35 students in a class. Fifteen...Ch. 3.1 - Prob. 64ECh. 3.1 - Prob. 65ECh. 3.1 - Prob. 66ECh. 3.1 - Whats the score? Jermaine has entered a bowling...Ch. 3.1 - Whats your grade? Addison has been told that her...Ch. 3.1 - Weighted mean: Rachel worked at three part-time...Ch. 3.1 - Weighted mean: In Jacobs statistics class, the...Ch. 3.1 - Mean or median? The Smith family in Example 3.5...Ch. 3.1 - Prob. 72ECh. 3.1 - Prob. 73ECh. 3.1 - Prob. 74ECh. 3.1 - Prob. 75ECh. 3.1 - Prob. 76ECh. 3.1 - Prob. 77ECh. 3.1 - Prob. 78ECh. 3.1 - Prob. 79ECh. 3.1 - Prob. 80ECh. 3.1 - Prob. 81ECh. 3.1 - Prob. 82ECh. 3.2 - In Exercises 11—14, fill in each blank with the...Ch. 3.2 - In Exercises 11—14, fill in each blank with the...Ch. 3.2 - In Exercises 11—14, fill in each blank with the...Ch. 3.2 - In Exercises 11—14, fill in each blank with the...Ch. 3.2 - In Exercises 15—18, determine whether the...Ch. 3.2 - In Exercises 15—18, determine whether the...Ch. 3.2 - In Exercises 15—18, determine whether the...Ch. 3.2 - In Exercises 15—18, determine whether the...Ch. 3.2 - Find the sample variance and standard deviation...Ch. 3.2 - Find the sample variance and standard deviation...Ch. 3.2 - Find the sample variance and standard deviation...Ch. 3.2 - Find the population variance and standard...Ch. 3.2 - Find the population variance and standard...Ch. 3.2 - Find the population variance and standard...Ch. 3.2 - Approximate the sample variance and standard...Ch. 3.2 - Approximate the sample variance and standard...Ch. 3.2 - Approximate the population variance and standard...Ch. 3.2 - Approximate the population variance and standard...Ch. 3.2 - Distances of the eight planets from the sun, in...Ch. 3.2 - A survey was taken in which people were asked how...Ch. 3.2 - The following TI-84 Plus display presents some...Ch. 3.2 - The following TI-84 Plus display presents some...Ch. 3.2 - The following TI-84 Plus display presents some...Ch. 3.2 - The following TI-84 Plus display presents some...Ch. 3.2 - Amazon: The following table presents the retail...Ch. 3.2 - Sports car or convertible? The following table...Ch. 3.2 - Heavy football players: Following are the weights,...Ch. 3.2 - Beer: The following table presents the number of...Ch. 3.2 - Whats your favorite TV show? The following tables...Ch. 3.2 - House prices: The following table presents prices,...Ch. 3.2 - Stock prices: Following are the closing prices of...Ch. 3.2 - Prob. 42ECh. 3.2 - Time to review: The following table presents the...Ch. 3.2 - Age distribution: The ages of residents of Banks...Ch. 3.2 - Lunch break: In a recent survey of 655 working...Ch. 3.2 - Pay your bills: In a large sample of customer...Ch. 3.2 - Newborn babies: A study conducted by the Center...Ch. 3.2 - Internet providers: In a survey of 600 homeowners...Ch. 3.2 - Lunch break: For the data in Exercise 45, estimate...Ch. 3.2 - Pay your bills: For the data in Exercise 46,...Ch. 3.2 - Newborn babies: For the data in Exercise 47,...Ch. 3.2 - Internet providers: For the data in Exercise 48,...Ch. 3.2 - Prob. 53ECh. 3.2 - Empirical Rule OK? The following histogram...Ch. 3.2 - Empirical Rule OK? The following histogram...Ch. 3.2 - Empirical Rule OK? The following histogram...Ch. 3.2 - Whats the temperature? The temperature in a...Ch. 3.2 - Find the standard deviation: The National Center...Ch. 3.2 - Find the standard deviation: The National Center...Ch. 3.2 - Price of electricity: The Energy Information...Ch. 3.2 - Possible or impossible? A data set has a mean of...Ch. 3.2 - Possible or impossible? A data set has a mean of...Ch. 3.2 - Prob. 63ECh. 3.2 - Prob. 64ECh. 3.2 - Height and weight: A Naona1 Center for Health...Ch. 3.2 - Test scores: Scores on a statistics exam had a...Ch. 3.2 - Mean absolute deviation: A measure of spread that...Ch. 3.2 - Prob. 68ECh. 3.3 - In Exercises 9—12, fill in each blank with the...Ch. 3.3 - In Exercises 9—12, fill in each blank with the...Ch. 3.3 - In Exercises 9—12, fill in each blank with the...Ch. 3.3 - In Exercises 9—12, fill in each blank with the...Ch. 3.3 - In Exercises 13—16, determine whether the...Ch. 3.3 - In Exercises 13—16, determine whether the...Ch. 3.3 - In Exercises 13—16, determine whether the...Ch. 3.3 - In Exercises 13—16, determine whether the...Ch. 3.3 - A popu1aon has mean =7 and standard deviation =2....Ch. 3.3 - A population has mean =25 and standard deviation...Ch. 3.3 - In Exercises 19 and 20, identify the outlier. Then...Ch. 3.3 - Prob. 20ECh. 3.3 - For the data set 37 82 20 25 31 10 41 44 4 36 68...Ch. 3.3 - For the data set Find the first and third...Ch. 3.3 - For the data set Find the 58th percentile. Find...Ch. 3.3 - For the data set Find the 80th percentile. Find...Ch. 3.3 - The following TI-84 Plus display presents the...Ch. 3.3 - Prob. 26ECh. 3.3 - Standardized tests: In a recent year, the mean...Ch. 3.3 - A fish story: The mean length of one-year-old...Ch. 3.3 - Blood pressure in men: The three quartiles for...Ch. 3.3 - Blood pressure in women: The article referred to...Ch. 3.3 - Hazardous waste: Following is a list of the number...Ch. 3.3 - Cholesterol levels: The National Health and...Ch. 3.3 - Commuting to work: Jamie drives to work every...Ch. 3.3 - Windy city by the bay: Following are wind speeds...Ch. 3.3 - Caffeine: Following are the number of grams of...Ch. 3.3 - Prob. 36ECh. 3.3 - Place your bets: In a recent year, 28 states in...Ch. 3.3 - Prob. 38ECh. 3.3 - Prob. 39ECh. 3.3 - Prob. 40ECh. 3.3 - Bragging rights: After learning his score on a...Ch. 3.3 - Who scored the highest? On a final exam in a large...Ch. 3.3 - Baseball salaries: In 2016, the Chicago Cubs...Ch. 3.3 - Prob. 44ECh. 3.3 - Prob. 45ECh. 3.3 - Prob. 46ECh. 3.3 - Prob. 47ECh. 3.3 - Boxplot possible? Following is the five-number...Ch. 3.3 - Unusual boxplot: Ten residents of a town were...Ch. 3.3 - Prob. 50ECh. 3.3 - Highly skewed data: Make up a data set in which...Ch. 3.3 - Highly skewed data: Make up a data set in which...Ch. 3.3 - Prob. 53ECh. 3.3 - Prob. 54ECh. 3.3 - z-scores and skewed data: Table 3.9 presents the...Ch. 3 - Of the mean, median and mode, which must be a...Ch. 3 - The prices (in dollars) for a sample of personal...Ch. 3 - Prob. 3CQCh. 3 - Prob. 4CQCh. 3 - Prob. 5CQCh. 3 - Prob. 6CQCh. 3 - Each of the following histograms represents a data...Ch. 3 - In Exercises 8—11, suppose that the mean...Ch. 3 - Prob. 9CQCh. 3 - In Exercises 8—11, suppose that the mean...Ch. 3 - Prob. 11CQCh. 3 - Prob. 12CQCh. 3 - Prob. 13CQCh. 3 - Prob. 14CQCh. 3 - Prob. 15CQCh. 3 - Prob. 1RECh. 3 - Prob. 2RECh. 3 - Prob. 3RECh. 3 - Prob. 4RECh. 3 - Prob. 5RECh. 3 - Prob. 6RECh. 3 - Measure that ball: Each of 16 students measured...Ch. 3 - Prob. 8RECh. 3 - Rivets: A machine makes rivets that are used in...Ch. 3 - Prob. 10RECh. 3 - Prob. 11RECh. 3 - Advertising costs: The amounts spent (in billions)...Ch. 3 - Prob. 13RECh. 3 - Prob. 14RECh. 3 - Prob. 15RECh. 3 - The U.S. Department of Labor annually publishes an...Ch. 3 - Explain why the Empirical Rule is more useful than...Ch. 3 - Prob. 3WAICh. 3 - Prob. 4WAICh. 3 - Percentiles are values that divide a data set into...Ch. 3 - Prob. 1CSCh. 3 - Prob. 2CSCh. 3 - Prob. 3CSCh. 3 - Prob. 4CSCh. 3 - Prob. 5CSCh. 3 - Prob. 6CSCh. 3 - Prob. 7CSCh. 3 - Prob. 8CSCh. 3 - Electronic devices contain electric circuits...
Knowledge Booster


Learn more about
Need a deep-dive on the concept behind this application? Look no further. Learn more about this topic, statistics and related others by exploring similar questions and additional content below.Similar questions
- You want to compare the average number of tines on the antlers of male deer in two nearby metro parks. A sample of 30 deer from the first park shows an average of 5 tines with a population standard deviation of 3. A sample of 35 deer from the second park shows an average of 6 tines with a population standard deviation of 3.2. Find a 95 percent confidence interval for the difference in average number of tines for all male deer in the two metro parks (second park minus first park).Do the parks’ deer populations differ in average size of deer antlers?arrow_forwardSuppose that you want to increase the confidence level of a particular confidence interval from 80 percent to 95 percent without changing the width of the confidence interval. Can you do it?arrow_forwardA random sample of 1,117 U.S. college students finds that 729 go home at least once each term. Find a 98 percent confidence interval for the proportion of all U.S. college students who go home at least once each term.arrow_forward
- Suppose that you make two confidence intervals with the same data set — one with a 95 percent confidence level and the other with a 99.7 percent confidence level. Which interval is wider?Is a wide confidence interval a good thing?arrow_forwardIs it true that a 95 percent confidence interval means you’re 95 percent confident that the sample statistic is in the interval?arrow_forwardTines can range from 2 to upwards of 50 or more on a male deer. You want to estimate the average number of tines on the antlers of male deer in a nearby metro park. A sample of 30 deer has an average of 5 tines, with a population standard deviation of 3. Find a 95 percent confidence interval for the average number of tines for all male deer in this metro park.Find a 98 percent confidence interval for the average number of tines for all male deer in this metro park.arrow_forward
- Based on a sample of 100 participants, the average weight loss the first month under a new (competing) weight-loss plan is 11.4 pounds with a population standard deviation of 5.1 pounds. The average weight loss for the first month for 100 people on the old (standard) weight-loss plan is 12.8 pounds, with population standard deviation of 4.8 pounds. Find a 90 percent confidence interval for the difference in weight loss for the two plans( old minus new) Whats the margin of error for your calculated confidence interval?arrow_forwardA 95 percent confidence interval for the average miles per gallon for all cars of a certain type is 32.1, plus or minus 1.8. The interval is based on a sample of 40 randomly selected cars. What units represent the margin of error?Suppose that you want to decrease the margin of error, but you want to keep 95 percent confidence. What should you do?arrow_forward3. (i) Below is the R code for performing a X2 test on a 2×3 matrix of categorical variables called TestMatrix: chisq.test(Test Matrix) (a) Assuming we have a significant result for this procedure, provide the R code (including any required packages) for an appropriate post hoc test. (b) If we were to apply this technique to a 2 × 2 case, how would we adapt the code in order to perform the correct test? (ii) What procedure can we use if we want to test for association when we have ordinal variables? What code do we use in R to do this? What package does this command belong to? (iii) The following code contains the initial steps for a scenario where we are looking to investigate the relationship between age and whether someone owns a car by using frequencies. There are two issues with the code - please state these. Row3<-c(75,15) Row4<-c(50,-10) MortgageMatrix<-matrix(c(Row1, Row4), byrow=T, nrow=2, MortgageMatrix dimnames=list(c("Yes", "No"), c("40 or older","<40")))…arrow_forward
- Describe the situation in which Fisher’s exact test would be used?(ii) When do we use Yates’ continuity correction (with respect to contingencytables)?[2 Marks] 2. Investigate, checking the relevant assumptions, whether there is an associationbetween age group and home ownership based on the sample dataset for atown below:Home Owner: Yes NoUnder 40 39 12140 and over 181 59Calculate and evaluate the effect size.arrow_forwardNot use ai pleasearrow_forwardNeed help with the following statistic problems.arrow_forward
arrow_back_ios
SEE MORE QUESTIONS
arrow_forward_ios
Recommended textbooks for you
 Glencoe Algebra 1, Student Edition, 9780079039897...AlgebraISBN:9780079039897Author:CarterPublisher:McGraw Hill
 Big Ideas Math A Bridge To Success Algebra 1: Stu...AlgebraISBN:9781680331141Author:HOUGHTON MIFFLIN HARCOURTPublisher:Houghton Mifflin Harcourt
Glencoe Algebra 1, Student Edition, 9780079039897...
Algebra
ISBN:9780079039897
Author:Carter
Publisher:McGraw Hill
Big Ideas Math A Bridge To Success Algebra 1: Stu...
Algebra
ISBN:9781680331141
Author:HOUGHTON MIFFLIN HARCOURT
Publisher:Houghton Mifflin Harcourt
The Shape of Data: Distributions: Crash Course Statistics #7; Author: CrashCourse;https://www.youtube.com/watch?v=bPFNxD3Yg6U;License: Standard YouTube License, CC-BY
Shape, Center, and Spread - Module 20.2 (Part 1); Author: Mrmathblog;https://www.youtube.com/watch?v=COaid7O_Gag;License: Standard YouTube License, CC-BY
Shape, Center and Spread; Author: Emily Murdock;https://www.youtube.com/watch?v=_YyW0DSCzpM;License: Standard Youtube License