
Finite Mathematics (11th Edition)
11th Edition
ISBN: 9780321979438
Author: Margaret L. Lial, Raymond N. Greenwell, Nathan P. Ritchey
Publisher: PEARSON
expand_more
expand_more
format_list_bulleted
Videos
Textbook Question
Chapter 3.2, Problem 4E
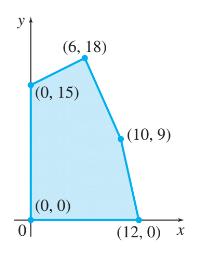
The following graphs show regions of feasible solutions. Use these regions to find maximum and minimum values of the given objective functions.
(a) z = 0.35x + 1.25y
(b) z= 9x + 4y
Expert Solution & Answer
Want to see the full answer?
Check out a sample textbook solution
Students have asked these similar questions
A fluid has density 800 kg/m³ and flows with velocity v = xi + yj + zk, where x, y, and z are measured in
meters, and the components of u are measured in meters per second. Find the rate of flow outward
through the part of the paraboloid z = 64 - x² - y² that lies above the xy plane.
۳/۱
: +0
العنوان
I need a detailed drawing with explanation
R₂ = X2
2) slots per pole per phase 3/31
Le
msl
180
60
Kd
Ka Sin (1)
Isin (6)
sin(30)
Sin (30)
اذا ميريد شرح الكتب بس 0 بالفراغ
3) Cos (30) 0.866
4) Rotating
5) Synchronous speed, 120 x 50
S = 1000-950
1000
Copper bosses: 5kw
Rotor input 5
6
: loo kw
6) 1
0.05
اذا ميريد شرح الكتب فقط 100
7) rotor
DC
1000
ined sove in peaper
I need a detailed
solution on paper
please
// Find the solution of:
|(2xy³ + 4x)y' = x²y² + y²
351
// Find the solution of: (1) 2xyy' = 1+ y²
01
175
T
Τ
M
Find the flux of the vector field F = (y,−x, 2²) through the helicoid with parameterization
r(u, v) = (u cos v, u sin v, v) 0 ≤ u≤ 3, 0 ≤v≤ oriented away from the origin.
Chapter 3 Solutions
Finite Mathematics (11th Edition)
Ch. 3.1 - Graph each linear inequality. x + y 2Ch. 3.1 - Graph each linear inequality. y x + 1Ch. 3.1 - Graph each linear inequality. x 2 yCh. 3.1 - Graph each linear inequality. y x 3Ch. 3.1 - Graph each linear inequality. 4x y 6Ch. 3.1 - Graph each linear inequality. 4y + x 6Ch. 3.1 - Graph each linear inequality. 7. 4x + y 8Ch. 3.1 - Graph each linear inequality. 2x y 2Ch. 3.1 - Graph each linear inequality. x + 3y 2Ch. 3.1 - Graph each linear inequality. 2x + 3y 6
Ch. 3.1 - Graph each linear inequality. x 3yCh. 3.1 - Graph each linear inequality. 2x yCh. 3.1 - Graph each linear inequality. x + y 0Ch. 3.1 - Graph each linear inequality. 3x + 2y 0Ch. 3.1 - Graph each linear inequality. y xCh. 3.1 - Graph each linear inequality. y 5xCh. 3.1 - Graph each linear inequality. x 4Ch. 3.1 - Graph each linear inequality. y 5Ch. 3.1 - Graph each linear inequality. y 2Ch. 3.1 - Graph each linear inequality. x 4Ch. 3.1 - Graph the feasible region for each system of...Ch. 3.1 - Graph the feasible region for each system of...Ch. 3.1 - Graph the feasible region for each system of...Ch. 3.1 - Graph the feasible region for each system of...Ch. 3.1 - Graph the feasible region for each system of...Ch. 3.1 - Graph the feasible region for each system of...Ch. 3.1 - Graph the feasible region for each system of...Ch. 3.1 - Graph the feasible region for each system of...Ch. 3.1 - Graph the feasible region for each system of...Ch. 3.1 - Graph the feasible region for each system of...Ch. 3.1 - Graph the feasible region for each system of...Ch. 3.1 - Graph the feasible region for each system of...Ch. 3.1 - Graph the feasible region for each system of...Ch. 3.1 - Graph the feasible region for each system of...Ch. 3.1 - Prob. 35ECh. 3.1 - Prob. 36ECh. 3.1 - Prob. 37ECh. 3.1 - Prob. 38ECh. 3.1 - The regions A through G in the figure can be...Ch. 3.1 - Production Scheduling A small pottery shop makes...Ch. 3.1 - Time Management Carmella and Walt produce handmade...Ch. 3.1 - Prob. 42ECh. 3.1 - Prob. 43ECh. 3.1 - Prob. 44ECh. 3.1 - For Exercises 42-47, perform the following steps....Ch. 3.1 - Prob. 46ECh. 3.1 - Prob. 47ECh. 3.2 - The following graphs show regions of feasible...Ch. 3.2 - The following graphs show regions of feasible...Ch. 3.2 - The following graphs show regions of feasible...Ch. 3.2 - The following graphs show regions of feasible...Ch. 3.2 - The following graphs show regions of feasible...Ch. 3.2 - Prob. 6ECh. 3.2 - Prob. 7ECh. 3.2 - Use graphical methods to solve each linear...Ch. 3.2 - Prob. 9ECh. 3.2 - Use graphical methods to solve each linear...Ch. 3.2 - Prob. 11ECh. 3.2 - Prob. 12ECh. 3.2 - Prob. 13ECh. 3.2 - Prob. 14ECh. 3.2 - Prob. 15ECh. 3.2 - Use graphical methods to solve each linear...Ch. 3.2 - Use graphical methods to solve each linear...Ch. 3.3 - Write Exercises 16 as linear inequalities....Ch. 3.3 - Prob. 2ECh. 3.3 - Prob. 3ECh. 3.3 - Prob. 4ECh. 3.3 - Prob. 5ECh. 3.3 - Prob. 6ECh. 3.3 - Transportation The Miers Company produces small...Ch. 3.3 - Transportation A manufacturer of refrigerators...Ch. 3.3 - Finance A pension fund manager decides to invest a...Ch. 3.3 - Profit A small country can grow only two crops for...Ch. 3.3 - Prob. 11ECh. 3.3 - Revenue A candy company has 150 kg of...Ch. 3.3 - Blending The Mostpure Milk Company gets milk from...Ch. 3.3 - Profit The Muro Manufacturing Company makes two...Ch. 3.3 - Prob. 15ECh. 3.3 - Revenue The manufacturing process requires that...Ch. 3.3 - Prob. 17ECh. 3.3 - Manufacturing (Note: Exercises #x2013;20 are from...Ch. 3.3 - Prob. 19ECh. 3.3 - Prob. 20ECh. 3.3 - Life Sciences Health Care David Willis takes...Ch. 3.3 - Prob. 22ECh. 3.3 - Nutrition A dietician is planning a snack package...Ch. 3.3 - Prob. 24ECh. 3.3 - Anthropology An anthropology article presents a...Ch. 3.3 - Prob. 26ECh. 3.3 - Prob. 27ECh. 3 - Use sensitivity analysis to find the optimal...Ch. 3 - Prob. 2EACh. 3 - Prob. 3EACh. 3 - Prob. 4EACh. 3 - Prob. 5EACh. 3 - Prob. 1RECh. 3 - Prob. 2RECh. 3 - Prob. 3RECh. 3 - Prob. 4RECh. 3 - Prob. 5RECh. 3 - Prob. 6RECh. 3 - Prob. 7RECh. 3 - Prob. 8RECh. 3 - Prob. 9RECh. 3 - Prob. 10RECh. 3 - Prob. 11RECh. 3 - Prob. 12RECh. 3 - Prob. 13RECh. 3 - How many constraints are we limited to in the...Ch. 3 - Prob. 15RECh. 3 - Prob. 16RECh. 3 - Prob. 17RECh. 3 - Prob. 18RECh. 3 - Prob. 19RECh. 3 - Prob. 20RECh. 3 - Prob. 21RECh. 3 - Prob. 22RECh. 3 - Prob. 23RECh. 3 - Prob. 24RECh. 3 - Prob. 25RECh. 3 - Prob. 26RECh. 3 - Prob. 27RECh. 3 - Use the given regions to find the maximum and...Ch. 3 - Prob. 29RECh. 3 - Prob. 30RECh. 3 - Prob. 31RECh. 3 - Prob. 32RECh. 3 - Prob. 33RECh. 3 - Prob. 34RECh. 3 - Prob. 35RECh. 3 - Prob. 36RECh. 3 - Prob. 37RECh. 3 - Cost Analysis DeMarco's pizza shop makes two...Ch. 3 - Prob. 39RECh. 3 - Revenue How many pizzas of each kind should the...Ch. 3 - Prob. 41RECh. 3 - Prob. 42RECh. 3 - Steel A steel company produces two types of...Ch. 3 - Prob. 44RECh. 3 - Prob. 45RECh. 3 - Prob. 46RE
Additional Math Textbook Solutions
Find more solutions based on key concepts
1. How much money is Joe earning when he’s 30?
Pathways To Math Literacy (looseleaf)
In Exercises 9-20, use the data in the following table, which lists drive-thru order accuracy at popular fast f...
Elementary Statistics (13th Edition)
Let F be a continuous distribution function. If U is uniformly distributed on (0,1), find the distribution func...
A First Course in Probability (10th Edition)
Find all solutions of each equation in the interval .
Precalculus: A Unit Circle Approach (3rd Edition)
For Problems 23-28, write in simpler form, as in Example 4. logbFG
Finite Mathematics for Business, Economics, Life Sciences and Social Sciences
The largest polynomial that divides evenly into a list of polynomials is called the _______.
Elementary & Intermediate Algebra
Knowledge Booster


Learn more about
Need a deep-dive on the concept behind this application? Look no further. Learn more about this topic, subject and related others by exploring similar questions and additional content below.Similar questions
- they take? 8.1.13 WP GO Tutorial An article in the Journal of Agricultural Science ["The Use of Residual Maximum Likelihood to Model Grain Quality Characteristics of Wheat with Variety, Climatic and Nitrogen Fertilizer Effects” (1997, Vol. 128, pp. 135–142)] investigated means of wheat grain crude protein content (CP) and Hagberg falling number (HFN) surveyed in the United Kingdom. The analysis used a variety of nitrogen fertilizer applications (kg N/ha), temperature (°C), and total monthly rainfall (mm). The following data below describe temperatures for wheat grown at Harper Adams Agricultural College between 1982 and 1993. The temperatures measured in June were obtained as follows: 15.2 14.2 14.0 12.2 14.4 12.5 14.3 14.2 13.5 11.8 15.2 Assume that the standard deviation is known to be σ = 0.5. a. Construct a 99% two-sided confidence interval on the mean temperature. b. Construct a 95% lower-confidence bound on the mean temperature. c. Suppose that you wanted to be 95% confident that…arrow_forward1 S 0 sin(lnx) x² - 1 Inx dxarrow_forward8.1.1 WP For a normal population with known variance σ², answer the following questions: - a. What is the confidence level for the interval x — 2.140/ √√n≤≤+2.140/√√n?arrow_forward
- 8.1.8 A civil engineer is analyzing the compressives trength of concrete. Compressive strength is normally distributed with σ2 = 1000(psi)2. A random sample of 12 specimens has a mean compressive strength ofx = 3250 psi. a. Construct a 95% two-sided confidence interval on mean compressive strength. b. Construct a 99% two-sided confidence interval on mean compressive strength. Compare the width of this confidence interval with the width of the one found in part (a). 8.1.9Suppose that in Exercise 8.1.8 it is desired to estimate the compressive strength with an error that is less than 15 psi at 99% confidence. What sample size is required?arrow_forward8.1.12 Ishikawa et al. [“Evaluation of Adhesiveness of Acinetobacter sp. Tol 5 to Abiotic Surfaces,” Journal of Bioscience and Bioengineering (Vol. 113(6), pp. 719–725)] studied the adhesion of various biofilms to solid surfaces for possible use in environmental technologies. Adhesion assay is conducted by measuring absorbance at A590. Suppose that for the bacterial strain Acinetobacter, five measurements gave readings of 2.69, 5.76, 2.67, 1.62, and 4.12 dyne-cm2. Assume that the standard deviation is known to be 0.66 dyne-cm2. a. Find a 95% confidence interval for the mean adhesion. b. If the scientists want the confidence interval to be no wider than 0.55 dyne-cm2, how many observations should they take?arrow_forwardAnswer questions 8.2.1 and 8.2.2 respectivelyarrow_forward
- 8.2.3 A research engineer for a tire manufacturer is investigating tire life for a new rubber compound and has built 16 tires and tested them to end-of-life in a road test. The sample mean and standard deviation are 60,139.7 and 3645.94 kilometers. Find a 95% confidence interval on mean tire life. 8.2.4 Determine the t-percentile that is required to construct each of the following one-sided confidence intervals: a. Confidence level = 95%, degrees of freedom = 14 b. Confidence level = 99%, degrees of freedom = 19 c. Confidence level = 99.9%, degrees of freedom = 24arrow_forward8.1.6The yield of a chemical process is being studied. From previous experience, yield is known to be normally distributed and σ = 3. The past 5 days of plant operation have resulted in the following percent yields: 91.6, 88.75, 90.8, 89.95, and 91.3. Find a 95% two-sided confidence interval on the true mean yield. 8.1.7 .A manufacturer produces piston rings for an automobile engine. It is known that ring diameter is normally distributed with σ = 0.001 millimeters. A random sample of 15 rings has a mean diameter of x = 74.036 millimeters. a. Construct a 99% two-sided confidence interval on the mean piston ring diameter. b. Construct a 99% lower-confidence bound on the mean piston ring diameter. Compare the lower bound of this confi- dence interval with the one in part (a).arrow_forward8.1.2 .Consider the one-sided confidence interval expressions for a mean of a normal population. a. What value of zα would result in a 90% CI? b. What value of zα would result in a 95% CI? c. What value of zα would result in a 99% CI? 8.1.3 A random sample has been taken from a normal distribution and the following confidence intervals constructed using the same data: (38.02, 61.98) and (39.95, 60.05) a. What is the value of the sample mean? b. One of these intervals is a 95% CI and the other is a 90% CI. Which one is the 95% CI and why?arrow_forward
- 8.1.4 . A confidence interval estimate is desired for the gain in a circuit on a semiconductor device. Assume that gain is normally distributed with standard deviation σ = 20. a. How large must n be if the length of the 95% CI is to be 40? b. How large must n be if the length of the 99% CI is to be 40? 8.1.5 Suppose that n = 100 random samples of water from a freshwater lake were taken and the calcium concentration (milligrams per liter) measured. A 95% CI on the mean calcium concentration is 0.49 g μ g 0.82. a. Would a 99% CI calculated from the same sample data be longer or shorter? b. Consider the following statement: There is a 95% chance that μ is between 0.49 and 0.82. Is this statement correct? Explain your answer. c. Consider the following statement: If n = 100 random samples of water from the lake were taken and the 95% CI on μ computed, and this process were repeated 1000 times, 950 of the CIs would contain the true value of μ. Is this statement correct? Explain your answerarrow_forward2 6. Modelling. Suppose that we have two tanks (A and B) between which a mixture of brine flows. Tank A contains 200 liters of water in which 50 kilograms of salt has been dissolved and Tank B contains 100 liters of pure water. Water containing 1kg of salt per liter is pumped into Tank A at the rate of 5 liters per minute. Brine mixture is pumped into Tank A from Tank B at the rate of 3 liters per minute and brine mixture is pumped from Tank A into Tank B at the rate of 8 liters per minute. Brine is drained from Tank B at a rate of 5 liters per minute. (a) Draw and carefully label a picture of the situation, including both tanks and the flow of brine between them. JankA 1ks of Salt Slits Pump EL Brine mit tark A from tank 13 Tank 13 k 3L zooliters of Ico liters of water with pure water. Saky salt → 777 disslore inside Brine mix is pumped from tank A to B of 82 Brine drainen min by Gf salt (b) Assume all brine mixtures are well-stirred. If we let t be the time in minutes, let x(t) 1ks…arrow_forward5. The graph of ƒ is given below. Sketch a graph of f'. 6. The graph of ƒ is given below. Sketch a graph of f'. 0 x 7. The graph of ƒ is given below. List the x-values where f is not differentiable. 0 A 2 4arrow_forward
arrow_back_ios
SEE MORE QUESTIONS
arrow_forward_ios
Recommended textbooks for you
 Glencoe Algebra 1, Student Edition, 9780079039897...AlgebraISBN:9780079039897Author:CarterPublisher:McGraw Hill
 Algebra for College StudentsAlgebraISBN:9781285195780Author:Jerome E. Kaufmann, Karen L. SchwittersPublisher:Cengage Learning
 Elementary Linear Algebra (MindTap Course List)AlgebraISBN:9781305658004Author:Ron LarsonPublisher:Cengage Learning
 College Algebra (MindTap Course List)AlgebraISBN:9781305652231Author:R. David Gustafson, Jeff HughesPublisher:Cengage Learning
 Algebra & Trigonometry with Analytic GeometryAlgebraISBN:9781133382119Author:SwokowskiPublisher:Cengage
 Algebra: Structure And Method, Book 1AlgebraISBN:9780395977224Author:Richard G. Brown, Mary P. Dolciani, Robert H. Sorgenfrey, William L. ColePublisher:McDougal Littell
Glencoe Algebra 1, Student Edition, 9780079039897...
Algebra
ISBN:9780079039897
Author:Carter
Publisher:McGraw Hill
Algebra for College Students
Algebra
ISBN:9781285195780
Author:Jerome E. Kaufmann, Karen L. Schwitters
Publisher:Cengage Learning
Elementary Linear Algebra (MindTap Course List)
Algebra
ISBN:9781305658004
Author:Ron Larson
Publisher:Cengage Learning
College Algebra (MindTap Course List)
Algebra
ISBN:9781305652231
Author:R. David Gustafson, Jeff Hughes
Publisher:Cengage Learning
Algebra & Trigonometry with Analytic Geometry
Algebra
ISBN:9781133382119
Author:Swokowski
Publisher:Cengage
Algebra: Structure And Method, Book 1
Algebra
ISBN:9780395977224
Author:Richard G. Brown, Mary P. Dolciani, Robert H. Sorgenfrey, William L. Cole
Publisher:McDougal Littell
Solve ANY Optimization Problem in 5 Steps w/ Examples. What are they and How do you solve them?; Author: Ace Tutors;https://www.youtube.com/watch?v=BfOSKc_sncg;License: Standard YouTube License, CC-BY
Types of solution in LPP|Basic|Multiple solution|Unbounded|Infeasible|GTU|Special case of LP problem; Author: Mechanical Engineering Management;https://www.youtube.com/watch?v=F-D2WICq8Sk;License: Standard YouTube License, CC-BY
Optimization Problems in Calculus; Author: Professor Dave Explains;https://www.youtube.com/watch?v=q1U6AmIa_uQ;License: Standard YouTube License, CC-BY
Introduction to Optimization; Author: Math with Dr. Claire;https://www.youtube.com/watch?v=YLzgYm2tN8E;License: Standard YouTube License, CC-BY