
Finite Mathematics (11th Edition)
11th Edition
ISBN: 9780321979438
Author: Margaret L. Lial, Raymond N. Greenwell, Nathan P. Ritchey
Publisher: PEARSON
expand_more
expand_more
format_list_bulleted
Videos
Textbook Question
Chapter 3.1, Problem 39E
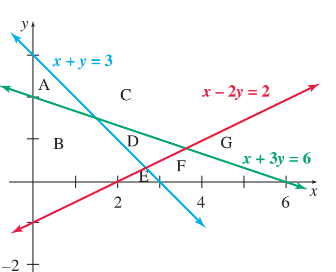
The regions A through G in the figure can be described by the inequalities
x + 3y ? 6
x + y ? 3
x – 2y ? 2
x ≥ 0
y ≥ 0,
where ? can be either ≤ or ≥. For each region, tell what the ? should be in the three inequalities. For example, for region A, the ? should be ≥,≤, and≤, because region A is described by the inequalities
x + 3y ≥ 6
x + y ≤ 3
x – 2y ≤ 2
x ≥ 0
y ≥ 0.
Expert Solution & Answer
Want to see the full answer?
Check out a sample textbook solution
Students have asked these similar questions
Explain the key points and reasons for 12.8.2 (1) and 12.8.2 (2)
Q1:
A slider in a machine moves along a fixed straight rod. Its
distance x cm along the rod is given below for various values of the time. Find the
velocity and acceleration of the slider when t = 0.3 seconds.
t(seconds)
x(cm)
0 0.1 0.2 0.3 0.4 0.5 0.6
30.13 31.62 32.87 33.64 33.95 33.81 33.24
Q2:
Using the Runge-Kutta method of fourth order, solve for y atr = 1.2,
From
dy_2xy +et
=
dx x²+xc*
Take h=0.2.
given x = 1, y = 0
Q3:Approximate the solution of the following equation
using finite difference method.
ly -(1-y=
y = x), y(1) = 2 and y(3) = −1
On the interval (1≤x≤3).(taking h=0.5).
Ф
sketch stability
x= -4x + 2xy - 8
y° =
4 y 2 - x²
чуг.
Chapter 3 Solutions
Finite Mathematics (11th Edition)
Ch. 3.1 - Graph each linear inequality. x + y 2Ch. 3.1 - Graph each linear inequality. y x + 1Ch. 3.1 - Graph each linear inequality. x 2 yCh. 3.1 - Graph each linear inequality. y x 3Ch. 3.1 - Graph each linear inequality. 4x y 6Ch. 3.1 - Graph each linear inequality. 4y + x 6Ch. 3.1 - Graph each linear inequality. 7. 4x + y 8Ch. 3.1 - Graph each linear inequality. 2x y 2Ch. 3.1 - Graph each linear inequality. x + 3y 2Ch. 3.1 - Graph each linear inequality. 2x + 3y 6
Ch. 3.1 - Graph each linear inequality. x 3yCh. 3.1 - Graph each linear inequality. 2x yCh. 3.1 - Graph each linear inequality. x + y 0Ch. 3.1 - Graph each linear inequality. 3x + 2y 0Ch. 3.1 - Graph each linear inequality. y xCh. 3.1 - Graph each linear inequality. y 5xCh. 3.1 - Graph each linear inequality. x 4Ch. 3.1 - Graph each linear inequality. y 5Ch. 3.1 - Graph each linear inequality. y 2Ch. 3.1 - Graph each linear inequality. x 4Ch. 3.1 - Graph the feasible region for each system of...Ch. 3.1 - Graph the feasible region for each system of...Ch. 3.1 - Graph the feasible region for each system of...Ch. 3.1 - Graph the feasible region for each system of...Ch. 3.1 - Graph the feasible region for each system of...Ch. 3.1 - Graph the feasible region for each system of...Ch. 3.1 - Graph the feasible region for each system of...Ch. 3.1 - Graph the feasible region for each system of...Ch. 3.1 - Graph the feasible region for each system of...Ch. 3.1 - Graph the feasible region for each system of...Ch. 3.1 - Graph the feasible region for each system of...Ch. 3.1 - Graph the feasible region for each system of...Ch. 3.1 - Graph the feasible region for each system of...Ch. 3.1 - Graph the feasible region for each system of...Ch. 3.1 - Prob. 35ECh. 3.1 - Prob. 36ECh. 3.1 - Prob. 37ECh. 3.1 - Prob. 38ECh. 3.1 - The regions A through G in the figure can be...Ch. 3.1 - Production Scheduling A small pottery shop makes...Ch. 3.1 - Time Management Carmella and Walt produce handmade...Ch. 3.1 - Prob. 42ECh. 3.1 - Prob. 43ECh. 3.1 - Prob. 44ECh. 3.1 - For Exercises 42-47, perform the following steps....Ch. 3.1 - Prob. 46ECh. 3.1 - Prob. 47ECh. 3.2 - The following graphs show regions of feasible...Ch. 3.2 - The following graphs show regions of feasible...Ch. 3.2 - The following graphs show regions of feasible...Ch. 3.2 - The following graphs show regions of feasible...Ch. 3.2 - The following graphs show regions of feasible...Ch. 3.2 - Prob. 6ECh. 3.2 - Prob. 7ECh. 3.2 - Use graphical methods to solve each linear...Ch. 3.2 - Prob. 9ECh. 3.2 - Use graphical methods to solve each linear...Ch. 3.2 - Prob. 11ECh. 3.2 - Prob. 12ECh. 3.2 - Prob. 13ECh. 3.2 - Prob. 14ECh. 3.2 - Prob. 15ECh. 3.2 - Use graphical methods to solve each linear...Ch. 3.2 - Use graphical methods to solve each linear...Ch. 3.3 - Write Exercises 16 as linear inequalities....Ch. 3.3 - Prob. 2ECh. 3.3 - Prob. 3ECh. 3.3 - Prob. 4ECh. 3.3 - Prob. 5ECh. 3.3 - Prob. 6ECh. 3.3 - Transportation The Miers Company produces small...Ch. 3.3 - Transportation A manufacturer of refrigerators...Ch. 3.3 - Finance A pension fund manager decides to invest a...Ch. 3.3 - Profit A small country can grow only two crops for...Ch. 3.3 - Prob. 11ECh. 3.3 - Revenue A candy company has 150 kg of...Ch. 3.3 - Blending The Mostpure Milk Company gets milk from...Ch. 3.3 - Profit The Muro Manufacturing Company makes two...Ch. 3.3 - Prob. 15ECh. 3.3 - Revenue The manufacturing process requires that...Ch. 3.3 - Prob. 17ECh. 3.3 - Manufacturing (Note: Exercises #x2013;20 are from...Ch. 3.3 - Prob. 19ECh. 3.3 - Prob. 20ECh. 3.3 - Life Sciences Health Care David Willis takes...Ch. 3.3 - Prob. 22ECh. 3.3 - Nutrition A dietician is planning a snack package...Ch. 3.3 - Prob. 24ECh. 3.3 - Anthropology An anthropology article presents a...Ch. 3.3 - Prob. 26ECh. 3.3 - Prob. 27ECh. 3 - Use sensitivity analysis to find the optimal...Ch. 3 - Prob. 2EACh. 3 - Prob. 3EACh. 3 - Prob. 4EACh. 3 - Prob. 5EACh. 3 - Prob. 1RECh. 3 - Prob. 2RECh. 3 - Prob. 3RECh. 3 - Prob. 4RECh. 3 - Prob. 5RECh. 3 - Prob. 6RECh. 3 - Prob. 7RECh. 3 - Prob. 8RECh. 3 - Prob. 9RECh. 3 - Prob. 10RECh. 3 - Prob. 11RECh. 3 - Prob. 12RECh. 3 - Prob. 13RECh. 3 - How many constraints are we limited to in the...Ch. 3 - Prob. 15RECh. 3 - Prob. 16RECh. 3 - Prob. 17RECh. 3 - Prob. 18RECh. 3 - Prob. 19RECh. 3 - Prob. 20RECh. 3 - Prob. 21RECh. 3 - Prob. 22RECh. 3 - Prob. 23RECh. 3 - Prob. 24RECh. 3 - Prob. 25RECh. 3 - Prob. 26RECh. 3 - Prob. 27RECh. 3 - Use the given regions to find the maximum and...Ch. 3 - Prob. 29RECh. 3 - Prob. 30RECh. 3 - Prob. 31RECh. 3 - Prob. 32RECh. 3 - Prob. 33RECh. 3 - Prob. 34RECh. 3 - Prob. 35RECh. 3 - Prob. 36RECh. 3 - Prob. 37RECh. 3 - Cost Analysis DeMarco's pizza shop makes two...Ch. 3 - Prob. 39RECh. 3 - Revenue How many pizzas of each kind should the...Ch. 3 - Prob. 41RECh. 3 - Prob. 42RECh. 3 - Steel A steel company produces two types of...Ch. 3 - Prob. 44RECh. 3 - Prob. 45RECh. 3 - Prob. 46RE
Knowledge Booster


Learn more about
Need a deep-dive on the concept behind this application? Look no further. Learn more about this topic, subject and related others by exploring similar questions and additional content below.Similar questions
- 2 Q/Given H (x,y) = x² + y² - y² Find the Hamiltonian System and prove it is first integral-arrow_forwardQ2) A: Find the region where ODEs has no limit cycle: x = y + x³ y=x+y+y³ 6arrow_forwardQ3)A: Given H(x,y)=x2-x+ y²as a first integral of an ODEs, find this ODES corresponding to H(x,y) and show the phase portrait by using Hartman theorem and by drawing graph of H(x,y)-e. Discuss the stability of critical points of the corresponding ODEs.arrow_forward
- Which angles are complementary to each other? Select all that apply. 3 2 4 in 5 1 Z1 and 23 Z1 and 25 22 and 23 Z2 and 25 Submitarrow_forwardWhich angles are adjacent to each other? Select all that apply. 3 2 4 67 5 8 11 10 12 12 9 27 and 28 Z9 and 12 Z3 and 24 Z10 and Z11arrow_forwardIf the arc length of NMP is 11π, what is the length of MNP expressed in terms of πT? M N 5 44% ○ A. 54π OB. 108π P О с. 103 18 O D. 108arrow_forward
arrow_back_ios
SEE MORE QUESTIONS
arrow_forward_ios
Recommended textbooks for you
 Algebra: Structure And Method, Book 1AlgebraISBN:9780395977224Author:Richard G. Brown, Mary P. Dolciani, Robert H. Sorgenfrey, William L. ColePublisher:McDougal Littell
 Holt Mcdougal Larson Pre-algebra: Student Edition...AlgebraISBN:9780547587776Author:HOLT MCDOUGALPublisher:HOLT MCDOUGAL
 Big Ideas Math A Bridge To Success Algebra 1: Stu...AlgebraISBN:9781680331141Author:HOUGHTON MIFFLIN HARCOURTPublisher:Houghton Mifflin Harcourt
 College Algebra (MindTap Course List)AlgebraISBN:9781305652231Author:R. David Gustafson, Jeff HughesPublisher:Cengage Learning
 Glencoe Algebra 1, Student Edition, 9780079039897...AlgebraISBN:9780079039897Author:CarterPublisher:McGraw Hill
 Elementary Geometry For College Students, 7eGeometryISBN:9781337614085Author:Alexander, Daniel C.; Koeberlein, Geralyn M.Publisher:Cengage,
Algebra: Structure And Method, Book 1
Algebra
ISBN:9780395977224
Author:Richard G. Brown, Mary P. Dolciani, Robert H. Sorgenfrey, William L. Cole
Publisher:McDougal Littell
Holt Mcdougal Larson Pre-algebra: Student Edition...
Algebra
ISBN:9780547587776
Author:HOLT MCDOUGAL
Publisher:HOLT MCDOUGAL
Big Ideas Math A Bridge To Success Algebra 1: Stu...
Algebra
ISBN:9781680331141
Author:HOUGHTON MIFFLIN HARCOURT
Publisher:Houghton Mifflin Harcourt
College Algebra (MindTap Course List)
Algebra
ISBN:9781305652231
Author:R. David Gustafson, Jeff Hughes
Publisher:Cengage Learning
Glencoe Algebra 1, Student Edition, 9780079039897...
Algebra
ISBN:9780079039897
Author:Carter
Publisher:McGraw Hill
Elementary Geometry For College Students, 7e
Geometry
ISBN:9781337614085
Author:Alexander, Daniel C.; Koeberlein, Geralyn M.
Publisher:Cengage,
2.1 Introduction to inequalities; Author: Oli Notes;https://www.youtube.com/watch?v=D6erN5YTlXE;License: Standard YouTube License, CC-BY
GCSE Maths - What are Inequalities? (Inequalities Part 1) #56; Author: Cognito;https://www.youtube.com/watch?v=e_tY6X5PwWw;License: Standard YouTube License, CC-BY
Introduction to Inequalities | Inequality Symbols | Testing Solutions for Inequalities; Author: Scam Squad Math;https://www.youtube.com/watch?v=paZSN7sV1R8;License: Standard YouTube License, CC-BY