
Finite Mathematics (11th Edition)
11th Edition
ISBN: 9780321979438
Author: Margaret L. Lial, Raymond N. Greenwell, Nathan P. Ritchey
Publisher: PEARSON
expand_more
expand_more
format_list_bulleted
Videos
Textbook Question
Chapter 3.2, Problem 1E
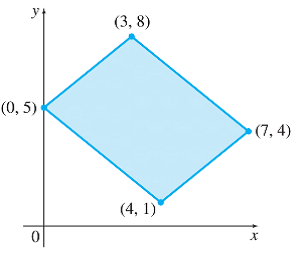
The following graphs show regions of feasible solutions. Use these regions to find maximum and minimum values of the given objective functions.
(a) z = 3x + 2y
(b) z = x + 4y
Expert Solution & Answer
Want to see the full answer?
Check out a sample textbook solution
Students have asked these similar questions
No chatgpt pls
Remix
4. Direction Fields/Phase Portraits. Use the given direction fields to plot solution curves
to each of the given initial value problems.
(a)
x = x+2y
1111
y = -3x+y
with x(0) = 1, y(0) = -1
(b) Consider the initial value problem corresponding to the given phase portrait.
x = y
y' = 3x + 2y
Draw two "straight line solutions"
passing through (0,0)
(c) Make guesses for the equations of the straight line solutions: y = ax.
It was homework
Chapter 3 Solutions
Finite Mathematics (11th Edition)
Ch. 3.1 - Graph each linear inequality. x + y 2Ch. 3.1 - Graph each linear inequality. y x + 1Ch. 3.1 - Graph each linear inequality. x 2 yCh. 3.1 - Graph each linear inequality. y x 3Ch. 3.1 - Graph each linear inequality. 4x y 6Ch. 3.1 - Graph each linear inequality. 4y + x 6Ch. 3.1 - Graph each linear inequality. 7. 4x + y 8Ch. 3.1 - Graph each linear inequality. 2x y 2Ch. 3.1 - Graph each linear inequality. x + 3y 2Ch. 3.1 - Graph each linear inequality. 2x + 3y 6
Ch. 3.1 - Graph each linear inequality. x 3yCh. 3.1 - Graph each linear inequality. 2x yCh. 3.1 - Graph each linear inequality. x + y 0Ch. 3.1 - Graph each linear inequality. 3x + 2y 0Ch. 3.1 - Graph each linear inequality. y xCh. 3.1 - Graph each linear inequality. y 5xCh. 3.1 - Graph each linear inequality. x 4Ch. 3.1 - Graph each linear inequality. y 5Ch. 3.1 - Graph each linear inequality. y 2Ch. 3.1 - Graph each linear inequality. x 4Ch. 3.1 - Graph the feasible region for each system of...Ch. 3.1 - Graph the feasible region for each system of...Ch. 3.1 - Graph the feasible region for each system of...Ch. 3.1 - Graph the feasible region for each system of...Ch. 3.1 - Graph the feasible region for each system of...Ch. 3.1 - Graph the feasible region for each system of...Ch. 3.1 - Graph the feasible region for each system of...Ch. 3.1 - Graph the feasible region for each system of...Ch. 3.1 - Graph the feasible region for each system of...Ch. 3.1 - Graph the feasible region for each system of...Ch. 3.1 - Graph the feasible region for each system of...Ch. 3.1 - Graph the feasible region for each system of...Ch. 3.1 - Graph the feasible region for each system of...Ch. 3.1 - Graph the feasible region for each system of...Ch. 3.1 - Prob. 35ECh. 3.1 - Prob. 36ECh. 3.1 - Prob. 37ECh. 3.1 - Prob. 38ECh. 3.1 - The regions A through G in the figure can be...Ch. 3.1 - Production Scheduling A small pottery shop makes...Ch. 3.1 - Time Management Carmella and Walt produce handmade...Ch. 3.1 - Prob. 42ECh. 3.1 - Prob. 43ECh. 3.1 - Prob. 44ECh. 3.1 - For Exercises 42-47, perform the following steps....Ch. 3.1 - Prob. 46ECh. 3.1 - Prob. 47ECh. 3.2 - The following graphs show regions of feasible...Ch. 3.2 - The following graphs show regions of feasible...Ch. 3.2 - The following graphs show regions of feasible...Ch. 3.2 - The following graphs show regions of feasible...Ch. 3.2 - The following graphs show regions of feasible...Ch. 3.2 - Prob. 6ECh. 3.2 - Prob. 7ECh. 3.2 - Use graphical methods to solve each linear...Ch. 3.2 - Prob. 9ECh. 3.2 - Use graphical methods to solve each linear...Ch. 3.2 - Prob. 11ECh. 3.2 - Prob. 12ECh. 3.2 - Prob. 13ECh. 3.2 - Prob. 14ECh. 3.2 - Prob. 15ECh. 3.2 - Use graphical methods to solve each linear...Ch. 3.2 - Use graphical methods to solve each linear...Ch. 3.3 - Write Exercises 16 as linear inequalities....Ch. 3.3 - Prob. 2ECh. 3.3 - Prob. 3ECh. 3.3 - Prob. 4ECh. 3.3 - Prob. 5ECh. 3.3 - Prob. 6ECh. 3.3 - Transportation The Miers Company produces small...Ch. 3.3 - Transportation A manufacturer of refrigerators...Ch. 3.3 - Finance A pension fund manager decides to invest a...Ch. 3.3 - Profit A small country can grow only two crops for...Ch. 3.3 - Prob. 11ECh. 3.3 - Revenue A candy company has 150 kg of...Ch. 3.3 - Blending The Mostpure Milk Company gets milk from...Ch. 3.3 - Profit The Muro Manufacturing Company makes two...Ch. 3.3 - Prob. 15ECh. 3.3 - Revenue The manufacturing process requires that...Ch. 3.3 - Prob. 17ECh. 3.3 - Manufacturing (Note: Exercises #x2013;20 are from...Ch. 3.3 - Prob. 19ECh. 3.3 - Prob. 20ECh. 3.3 - Life Sciences Health Care David Willis takes...Ch. 3.3 - Prob. 22ECh. 3.3 - Nutrition A dietician is planning a snack package...Ch. 3.3 - Prob. 24ECh. 3.3 - Anthropology An anthropology article presents a...Ch. 3.3 - Prob. 26ECh. 3.3 - Prob. 27ECh. 3 - Use sensitivity analysis to find the optimal...Ch. 3 - Prob. 2EACh. 3 - Prob. 3EACh. 3 - Prob. 4EACh. 3 - Prob. 5EACh. 3 - Prob. 1RECh. 3 - Prob. 2RECh. 3 - Prob. 3RECh. 3 - Prob. 4RECh. 3 - Prob. 5RECh. 3 - Prob. 6RECh. 3 - Prob. 7RECh. 3 - Prob. 8RECh. 3 - Prob. 9RECh. 3 - Prob. 10RECh. 3 - Prob. 11RECh. 3 - Prob. 12RECh. 3 - Prob. 13RECh. 3 - How many constraints are we limited to in the...Ch. 3 - Prob. 15RECh. 3 - Prob. 16RECh. 3 - Prob. 17RECh. 3 - Prob. 18RECh. 3 - Prob. 19RECh. 3 - Prob. 20RECh. 3 - Prob. 21RECh. 3 - Prob. 22RECh. 3 - Prob. 23RECh. 3 - Prob. 24RECh. 3 - Prob. 25RECh. 3 - Prob. 26RECh. 3 - Prob. 27RECh. 3 - Use the given regions to find the maximum and...Ch. 3 - Prob. 29RECh. 3 - Prob. 30RECh. 3 - Prob. 31RECh. 3 - Prob. 32RECh. 3 - Prob. 33RECh. 3 - Prob. 34RECh. 3 - Prob. 35RECh. 3 - Prob. 36RECh. 3 - Prob. 37RECh. 3 - Cost Analysis DeMarco's pizza shop makes two...Ch. 3 - Prob. 39RECh. 3 - Revenue How many pizzas of each kind should the...Ch. 3 - Prob. 41RECh. 3 - Prob. 42RECh. 3 - Steel A steel company produces two types of...Ch. 3 - Prob. 44RECh. 3 - Prob. 45RECh. 3 - Prob. 46RE
Additional Math Textbook Solutions
Find more solutions based on key concepts
In Exercises 9-20, use the data in the following table, which lists drive-thru order accuracy at popular fast f...
Elementary Statistics (13th Edition)
1. How much money is Joe earning when he’s 30?
Pathways To Math Literacy (looseleaf)
True or False The quotient of two polynomial expressions is a rational expression, (p. A35)
Precalculus
First Derivative Test a. Locale the critical points of f. b. Use the First Derivative Test to locale the local ...
Calculus: Early Transcendentals (2nd Edition)
For Problems 23-28, write in simpler form, as in Example 4. logbFG
Finite Mathematics for Business, Economics, Life Sciences and Social Sciences
1. How is a sample related to a population?
Elementary Statistics: Picturing the World (7th Edition)
Knowledge Booster


Learn more about
Need a deep-dive on the concept behind this application? Look no further. Learn more about this topic, subject and related others by exploring similar questions and additional content below.Similar questions
- No chatgpt pls will upvotearrow_forward(7) (12 points) Let F(x, y, z) = (y, x+z cos yz, y cos yz). Ꮖ (a) (4 points) Show that V x F = 0. (b) (4 points) Find a potential f for the vector field F. (c) (4 points) Let S be a surface in R3 for which the Stokes' Theorem is valid. Use Stokes' Theorem to calculate the line integral Jos F.ds; as denotes the boundary of S. Explain your answer.arrow_forward(3) (16 points) Consider z = uv, u = x+y, v=x-y. (a) (4 points) Express z in the form z = fog where g: R² R² and f: R² → R. (b) (4 points) Use the chain rule to calculate Vz = (2, 2). Show all intermediate steps otherwise no credit. (c) (4 points) Let S be the surface parametrized by T(x, y) = (x, y, ƒ (g(x, y)) (x, y) = R². Give a parametric description of the tangent plane to S at the point p = T(x, y). (d) (4 points) Calculate the second Taylor polynomial Q(x, y) (i.e. the quadratic approximation) of F = (fog) at a point (a, b). Verify that Q(x,y) F(a+x,b+y). =arrow_forward
- (6) (8 points) Change the order of integration and evaluate (z +4ry)drdy . So S√ ² 0arrow_forward(10) (16 points) Let R>0. Consider the truncated sphere S given as x² + y² + (z = √15R)² = R², z ≥0. where F(x, y, z) = −yi + xj . (a) (8 points) Consider the vector field V (x, y, z) = (▼ × F)(x, y, z) Think of S as a hot-air balloon where the vector field V is the velocity vector field measuring the hot gasses escaping through the porous surface S. The flux of V across S gives the volume flow rate of the gasses through S. Calculate this flux. Hint: Parametrize the boundary OS. Then use Stokes' Theorem. (b) (8 points) Calculate the surface area of the balloon. To calculate the surface area, do the following: Translate the balloon surface S by the vector (-15)k. The translated surface, call it S+ is part of the sphere x² + y²+z² = R². Why do S and S+ have the same area? ⚫ Calculate the area of S+. What is the natural spherical parametrization of S+?arrow_forward(1) (8 points) Let c(t) = (et, et sint, et cost). Reparametrize c as a unit speed curve starting from the point (1,0,1).arrow_forward
- (9) (16 points) Let F(x, y, z) = (x² + y − 4)i + 3xyj + (2x2 +z²)k = - = (x²+y4,3xy, 2x2 + 2²). (a) (4 points) Calculate the divergence and curl of F. (b) (6 points) Find the flux of V x F across the surface S given by x² + y²+2² = 16, z ≥ 0. (c) (6 points) Find the flux of F across the boundary of the unit cube E = [0,1] × [0,1] x [0,1].arrow_forward(8) (12 points) (a) (8 points) Let C be the circle x² + y² = 4. Let F(x, y) = (2y + e²)i + (x + sin(y²))j. Evaluate the line integral JF. F.ds. Hint: First calculate V x F. (b) (4 points) Let S be the surface r² + y² + z² = 4, z ≤0. Calculate the flux integral √(V × F) F).dS. Justify your answer.arrow_forwardDetermine whether the Law of Sines or the Law of Cosines can be used to find another measure of the triangle. a = 13, b = 15, C = 68° Law of Sines Law of Cosines Then solve the triangle. (Round your answers to four decimal places.) C = 15.7449 A = 49.9288 B = 62.0712 × Need Help? Read It Watch Itarrow_forward
- (4) (10 points) Evaluate √(x² + y² + z²)¹⁄² exp[}(x² + y² + z²)²] dV where D is the region defined by 1< x² + y²+ z² ≤4 and √√3(x² + y²) ≤ z. Note: exp(x² + y²+ 2²)²] means el (x²+ y²+=²)²]¸arrow_forward(2) (12 points) Let f(x,y) = x²e¯. (a) (4 points) Calculate Vf. (b) (4 points) Given x directional derivative 0, find the line of vectors u = D₁f(x, y) = 0. (u1, 2) such that the - (c) (4 points) Let u= (1+3√3). Show that Duƒ(1, 0) = ¦|▼ƒ(1,0)| . What is the angle between Vf(1,0) and the vector u? Explain.arrow_forwardFind the missing values by solving the parallelogram shown in the figure. (The lengths of the diagonals are given by c and d. Round your answers to two decimal places.) a b 29 39 66.50 C 17.40 d 0 54.0 126° a Ꮎ b darrow_forward
arrow_back_ios
SEE MORE QUESTIONS
arrow_forward_ios
Recommended textbooks for you
 Glencoe Algebra 1, Student Edition, 9780079039897...AlgebraISBN:9780079039897Author:CarterPublisher:McGraw Hill
 Algebra for College StudentsAlgebraISBN:9781285195780Author:Jerome E. Kaufmann, Karen L. SchwittersPublisher:Cengage Learning
 Elementary Linear Algebra (MindTap Course List)AlgebraISBN:9781305658004Author:Ron LarsonPublisher:Cengage Learning
 College Algebra (MindTap Course List)AlgebraISBN:9781305652231Author:R. David Gustafson, Jeff HughesPublisher:Cengage Learning
 Algebra: Structure And Method, Book 1AlgebraISBN:9780395977224Author:Richard G. Brown, Mary P. Dolciani, Robert H. Sorgenfrey, William L. ColePublisher:McDougal Littell
 Algebra & Trigonometry with Analytic GeometryAlgebraISBN:9781133382119Author:SwokowskiPublisher:Cengage
Glencoe Algebra 1, Student Edition, 9780079039897...
Algebra
ISBN:9780079039897
Author:Carter
Publisher:McGraw Hill
Algebra for College Students
Algebra
ISBN:9781285195780
Author:Jerome E. Kaufmann, Karen L. Schwitters
Publisher:Cengage Learning
Elementary Linear Algebra (MindTap Course List)
Algebra
ISBN:9781305658004
Author:Ron Larson
Publisher:Cengage Learning
College Algebra (MindTap Course List)
Algebra
ISBN:9781305652231
Author:R. David Gustafson, Jeff Hughes
Publisher:Cengage Learning
Algebra: Structure And Method, Book 1
Algebra
ISBN:9780395977224
Author:Richard G. Brown, Mary P. Dolciani, Robert H. Sorgenfrey, William L. Cole
Publisher:McDougal Littell
Algebra & Trigonometry with Analytic Geometry
Algebra
ISBN:9781133382119
Author:Swokowski
Publisher:Cengage
Solve ANY Optimization Problem in 5 Steps w/ Examples. What are they and How do you solve them?; Author: Ace Tutors;https://www.youtube.com/watch?v=BfOSKc_sncg;License: Standard YouTube License, CC-BY
Types of solution in LPP|Basic|Multiple solution|Unbounded|Infeasible|GTU|Special case of LP problem; Author: Mechanical Engineering Management;https://www.youtube.com/watch?v=F-D2WICq8Sk;License: Standard YouTube License, CC-BY
Optimization Problems in Calculus; Author: Professor Dave Explains;https://www.youtube.com/watch?v=q1U6AmIa_uQ;License: Standard YouTube License, CC-BY
Introduction to Optimization; Author: Math with Dr. Claire;https://www.youtube.com/watch?v=YLzgYm2tN8E;License: Standard YouTube License, CC-BY