
Videos
a.
Find the values
a.
Answer to Problem 16P
The values of
The values of
Explanation of Solution
Step-by-step procedure to verify
- Press STAT.
- Select Edit.
- Enter the values in L1.
- Press STAT and Choose CALC.
- Select 1-Var Stats.
- To select the variable L1, Press2-nd and then press 1.
- Press Enter.
The output obtained using the Ti83 calculator is as given below:
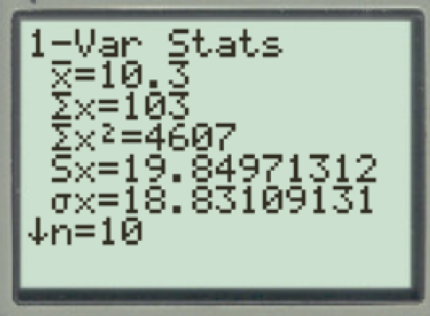
From the output, the values of
Step-by-step procedure to verify
- Press STAT.
- Select Edit.
- Enter the values in L2.
- Press STAT and Choose CALC.
- Select 1-Var Stats.
- To select the variable L2, Press2-nd and then press 2.
- Press Enter.
The output obtained using the Ti83 calculator is as given below:
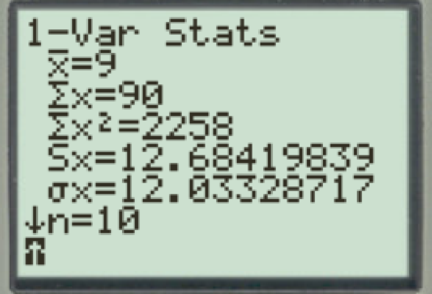
From the output, the values of
b.
Find the sample
b.
Answer to Problem 16P
The values of sample mean, variance, and standard deviation for x using the computation formula are10.3, 394.0, and 19.85, respectively.
The values of sample mean, variance, and standard deviation for y using the computation formula are9, 160.9, and 12.68, respectively.
Explanation of Solution
The sample variance using the computation formula is as follows:
Where,
The sample standard deviation using the computation formula is as follows:
Where,
The sample mean for x is obtained as given below:
Thus, the sample mean is 10.3.
The sample variance for x using the computation formula is obtained as given below:
Thus, the sample variance for x using the computation formula is 394.0.
The sample standard deviation for x using the computation formula is as obtained below:
Thus, the sample standard deviation for x using the computation formula is 19.85.
The sample mean for y is obtained as given below:
Thus, the sample mean is 9.
The sample variance for y using the computation formula is obtained as given below:
Thus, the sample variance for y using the computation formula is 160.9.
The sample standard deviation for y using the computation formula is obtained as given below:
Thus, the sample standard deviation for y using the computation formula is 12.68.
c.
Find the 75% Chebyshev interval around the mean for each fund.
Compare the two funds.
c.
Answer to Problem 16P
The 75% Chebyshev interval around the mean for the fund Vanguard Total Stock Index is–29.4 and 50.
The 75% Chebyshev interval around the mean for the fund Vanguard Balanced Index is –16.36 and 34.36.
Explanation of Solution
The 75% Chebyshev interval around the mean for the fund Vanguard Total Stock Index is obtained as given below:
Thus, the 75% Chebyshev interval around the mean for the fund Vanguard Total Stock Index is –29.4 and 50.
The 75% Chebyshev interval around the mean for the fund Vanguard Balanced Index is obtained as given below:
Thus, the 75% Chebyshev interval around the mean for the fund Vanguard Balanced Index is –16.36 and 34.36.
From the result, it is observed that the 75% returns lie in the 75% Chebyshev interval for both the funds.
d.
Find and compare the coefficient of variation for x and y.
d.
Answer to Problem 16P
The coefficient of variation for x is 192.7%.
The coefficient of variation for y is 140.9%.
Explanation of Solution
The formula for the coefficient of variation is as follows:
Where, s is the sample standard deviation and
The coefficient of variation for x is obtained as given below:
Thus, the coefficient of variation for x is 192.7%.
The coefficient of variation for y is obtained as given below:
Thus, the coefficient of variation for y is 140.9%.
From the results, the coefficient of variation for the fund Vanguard Balanced Index is less when compared to the coefficient of variation for the fund Vanguard Total Stock Index. Hence, the fund Vanguard Balanced Index has less risk per unit of return. Hence, the fund Vanguard Balanced Index appears to be better.
Want to see more full solutions like this?
Chapter 3 Solutions
Understandable Statistics: Concepts and Methods


- A company found that the daily sales revenue of its flagship product follows a normal distribution with a mean of $4500 and a standard deviation of $450. The company defines a "high-sales day" that is, any day with sales exceeding $4800. please provide a step by step on how to get the answers in excel Q: What percentage of days can the company expect to have "high-sales days" or sales greater than $4800? Q: What is the sales revenue threshold for the bottom 10% of days? (please note that 10% refers to the probability/area under bell curve towards the lower tail of bell curve) Provide answers in the yellow cellsarrow_forwardFind the critical value for a left-tailed test using the F distribution with a 0.025, degrees of freedom in the numerator=12, and degrees of freedom in the denominator = 50. A portion of the table of critical values of the F-distribution is provided. Click the icon to view the partial table of critical values of the F-distribution. What is the critical value? (Round to two decimal places as needed.)arrow_forwardA retail store manager claims that the average daily sales of the store are $1,500. You aim to test whether the actual average daily sales differ significantly from this claimed value. You can provide your answer by inserting a text box and the answer must include: Null hypothesis, Alternative hypothesis, Show answer (output table/summary table), and Conclusion based on the P value. Showing the calculation is a must. If calculation is missing,so please provide a step by step on the answers Numerical answers in the yellow cellsarrow_forward
 Glencoe Algebra 1, Student Edition, 9780079039897...AlgebraISBN:9780079039897Author:CarterPublisher:McGraw Hill
 Functions and Change: A Modeling Approach to Coll...AlgebraISBN:9781337111348Author:Bruce Crauder, Benny Evans, Alan NoellPublisher:Cengage Learning
 Algebra & Trigonometry with Analytic GeometryAlgebraISBN:9781133382119Author:SwokowskiPublisher:Cengage
 Trigonometry (MindTap Course List)TrigonometryISBN:9781337278461Author:Ron LarsonPublisher:Cengage Learning
 Linear Algebra: A Modern IntroductionAlgebraISBN:9781285463247Author:David PoolePublisher:Cengage Learning