
Videos
a.
Check whether there is a guaranteed amount of water the farmers, ranchers, and cities will get from the Yellowstone River each year.
a.
Answer to Problem 9CRP
No, there is no guaranteed amount of water the farmers, ranchers, and cities get from the Yellowstone River each year.
Explanation of Solution
The important source of water for wildlife, rancher, farmers, and cities downstream is Yellowstone River. The data show that the annual flow for recent 19 years of the Yellowstone River, which does not show any guarantee that they give water for each year.
The annual flows are random variables. Hence, there is no guaranteed amount of water the farmers, ranchers, and cities will get from the Yellowstone River each year.
b.
Find the expected annual flow from the Yellowstone snowmelt.
Find the
b.
Answer to Problem 9CRP
The expected annual flow from the Yellowstone snowmelt is 27.05.
The value of mean is 27.05.
The value of median is 25.9.
The value of mode is 25.9.
Explanation of Solution
Step-by-step procedure to obtain the mean, median, and mode using the MINITAB software:
- Choose Stat > Basic Statistics > Display
Descriptive Statistics . - In Variables enter the columns Annual flow.
- Check Options, Select Mean, Median and Mode.
- Click OK in all dialogue boxes.
The output obtained using the MINITAB software is given below:
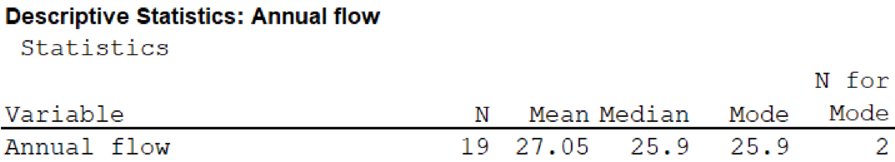
From the MINITAB output, the value of mean is 27.05, the value of median is 25.9, and the value of mode is 25.9.
c.
Find the
c.
Answer to Problem 9CRP
The range is 27.6.
The value of standard deviation is 6.61.
Explanation of Solution
Step-by-step procedure to obtain the range and standard deviation using the MINITAB software:
- Choose Stat > Basic Statistics > Display Descriptive Statistics.
- In Variables enter the columns Annual flow.
- Check Options, Select Mean, Median and Mode.
- Click OK in all dialogue boxes.
The output obtained using the MINITAB software is given below:
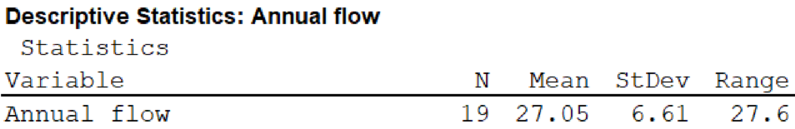
From the MINITAB output, the range is 27.6 and the value of standard deviation is 6.61.
d.
Find the 75% Chebyshev interval around the mean.
d.
Answer to Problem 9CRP
The 75% Chebyshev interval around the mean is 13.83 and 40.27.
Explanation of Solution
The 75% Chebyshev interval around the mean is obtained below:
Thus, the 75% Chebyshev interval around the mean for Grid E is 0.77 and 39.93.
e.
Find the five-number summary of the annual water flow.
Draw the box-and-whisker plot.
Interpret the five-number summary and box-and-whisker plot.
Find the values where the middle portion of the data lies.
Find the
Identify the data outliers.
e.
Answer to Problem 9CRP
The five-number summary of the annual water flow is 17.5, 23.7, 25.9, 31.8, and 45.1.
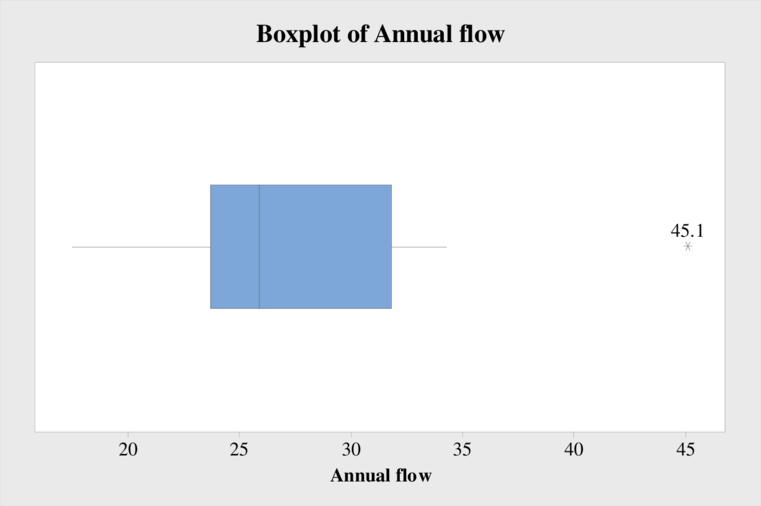
The box-and-whisker plot is shown below:
The middle portion of the data lies between 23.7 and 31.8.
The value of interquartile range is 8.1.
The value 45.1 is an outlier.
Explanation of Solution
Step-by-step procedure to obtain the five-number summary of the annual water flow using MINITAB software:
- Choose Stat > Basic Statistics > Display Descriptive Statistics.
- In Variables enter the columns Annual flow.
- Check Options, Select Minimum, Maximum, first
quartile , Median, third quartile and IQR. - Click OK in all dialogue boxes.
The output obtained using the MINITAB software is given below:
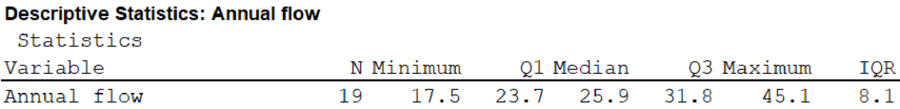
From the MINITAB output, the five-number summary of annual water flow is 17.5, 23.7, 25.9, 31.8, and 45.1.
Step-by-step procedure to draw the box-and-whisker plot using the MINITAB software:
- Choose Graph > Boxplot or Stat > EDA > Boxplot.
- Under One Y, choose Simple. Click OK.
- In Graph variables, enter the data of Annual flow.
- Click OK in all dialogue boxes.
Interpretation:
From the box-and-whisker plot, it is observed that the distribution of the annual water flow is skewed to the right.
From the output, it is observed that the middle portion of the data lies between 23.7 and 31.8.
From the MINITAB output, the value of interquartile range is 8.1.
From the box-and-whisker plot, it is observed that the value 45.1 is an outlier.
f.
Check whether the Madison is more reliable using the coefficient of variation.
f.
Explanation of Solution
Step-by-step procedure to obtain the coefficient of variation using the MINITAB software:
- Choose Stat > Basic Statistics > Display Descriptive Statistics.
- In Variables enter the columns Yellowstone and Madison.
- Check Options, Select coefficient of variation.
- Click OK in all dialogue boxes.
The output obtained using the MINITAB software is given below:
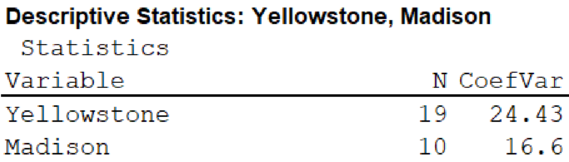
From the MINITAB output, the coefficient of variation for the annual water flow of Yellowstone is 24.43, and the coefficient of variation for the annual water flow of Madison is 16.6.
From the result, it is observed that the coefficient of variation for the water flow of Madison is smaller when compared to the coefficient of variation for the annual water flow of Yellowstone. This indicates that the spread of river flow is smaller for Madison river. Hence, the Madison flower is more consistent.
g.
Check whether it is safe to allocate at least 27 units of Yellowstone River water each year for agricultural and domestic use.
g.
Explanation of Solution
From the results, it is observed that the median water flow of Yellowstone River is 25.9, which indicates that more than half of the river flows are below 27 units.
Hence, it is not safe to allocate at least 27 units of Yellowstone River water each year for agricultural and domestic use.
Want to see more full solutions like this?
Chapter 3 Solutions
Understandable Statistics: Concepts and Methods


- 4 (MLE of ARCH) Suppose rt follows ARCH(2) with E(rt) = 0, rt = ut, ut = στει, σε where {+} is a sequence of independent and identically distributed (iid) standard normal random variables. With observations r₁,...,, write down the log-likelihood function for the model esti- mation.arrow_forward5 (Moments of GARCH) For the GARCH(2,2) model rt = 0.2+0.25u1+0.05u-2 +0.30% / -1 +0.20% -2, find cov(rt). 0.0035 ut, ut = στει,στ =arrow_forwardDefinition of null hypothesis from the textbook Definition of alternative hypothesis from the textbook Imagine this: you suspect your beloved Chicken McNugget is shrinking. Inflation is hitting everything else, so why not the humble nugget too, right? But your sibling thinks you’re just being dramatic—maybe you’re just extra hungry today. Determined to prove them wrong, you take matters (and nuggets) into your own hands. You march into McDonald’s, get two 20-piece boxes, and head home like a scientist on a mission. Now, before you start weighing each nugget like they’re precious gold nuggets, let’s talk hypotheses. The average weight of nuggets as mentioned on the box is 16 g each. Develop your null and alternative hypotheses separately. Next, you weigh each nugget with the precision of a jeweler and find they average out to 15.5 grams. You also conduct a statistical analysis, and the p-value turns out to be 0.01. Based on this information, answer the following questions. (Remember,…arrow_forward
- Business Discussarrow_forwardCape Fear Community Colle X ALEKS ALEKS - Dorothy Smith - Sec X www-awu.aleks.com/alekscgi/x/Isl.exe/10_u-IgNslkr7j8P3jH-IQ1w4xc5zw7yX8A9Q43nt5P1XWJWARE... Section 7.1,7.2,7.3 HW 三 Question 21 of 28 (1 point) | Question Attempt: 5 of Unlimited The proportion of phones that have more than 47 apps is 0.8783 Part: 1 / 2 Part 2 of 2 (b) Find the 70th The 70th percentile of the number of apps. Round the answer to two decimal places. percentile of the number of apps is Try again Skip Part Recheck Save 2025 Mcarrow_forwardHi, I need to sort out where I went wrong. So, please us the data attached and run four separate regressions, each using the Recruiters rating as the dependent variable and GMAT, Accept Rate, Salary, and Enrollment, respectively, as a single independent variable. Interpret this equation. Round your answers to four decimal places, if necessary. If your answer is negative number, enter "minus" sign. Equation for GMAT: Ŷ = _______ + _______ GMAT Equation for Accept Rate: Ŷ = _______ + _______ Accept Rate Equation for Salary: Ŷ = _______ + _______ Salary Equation for Enrollment: Ŷ = _______ + _______ Enrollmentarrow_forward
- Question 21 of 28 (1 point) | Question Attempt: 5 of Unlimited Dorothy ✔ ✓ 12 ✓ 13 ✓ 14 ✓ 15 ✓ 16 ✓ 17 ✓ 18 ✓ 19 ✓ 20 = 21 22 > How many apps? According to a website, the mean number of apps on a smartphone in the United States is 82. Assume the number of apps is normally distributed with mean 82 and standard deviation 30. Part 1 of 2 (a) What proportion of phones have more than 47 apps? Round the answer to four decimal places. The proportion of phones that have more than 47 apps is 0.8783 Part: 1/2 Try again kip Part ی E Recheck == == @ W D 80 F3 151 E R C レ Q FA 975 % T B F5 10 の 000 园 Save For Later Submit Assignment © 2025 McGraw Hill LLC. All Rights Reserved. Terms of Use | Privacy Center | Accessibility Y V& U H J N * 8 M I K O V F10 P = F11 F12 . darrow_forwardYou are provided with data that includes all 50 states of the United States. Your task is to draw a sample of: 20 States using Random Sampling (2 points: 1 for random number generation; 1 for random sample) 10 States using Systematic Sampling (4 points: 1 for random numbers generation; 1 for generating random sample different from the previous answer; 1 for correct K value calculation table; 1 for correct sample drawn by using systematic sampling) (For systematic sampling, do not use the original data directly. Instead, first randomize the data, and then use the randomized dataset to draw your sample. Furthermore, do not use the random list previously generated, instead, generate a new random sample for this part. For more details, please see the snapshot provided at the end.) You are provided with data that includes all 50 states of the United States. Your task is to draw a sample of: o 20 States using Random Sampling (2 points: 1 for random number generation; 1 for random sample) o…arrow_forwardCourse Home ✓ Do Homework - Practice Ques ✓ My Uploads | bartleby + mylab.pearson.com/Student/PlayerHomework.aspx?homeworkId=688589738&questionId=5&flushed=false&cid=8110079¢erwin=yes Online SP 2025 STA 2023-009 Yin = Homework: Practice Questions Exam 3 Question list * Question 3 * Question 4 ○ Question 5 K Concluir atualização: Ava Pearl 04/02/25 9:28 AM HW Score: 71.11%, 12.09 of 17 points ○ Points: 0 of 1 Save Listed in the accompanying table are weights (kg) of randomly selected U.S. Army male personnel measured in 1988 (from "ANSUR I 1988") and different weights (kg) of randomly selected U.S. Army male personnel measured in 2012 (from "ANSUR II 2012"). Assume that the two samples are independent simple random samples selected from normally distributed populations. Do not assume that the population standard deviations are equal. Complete parts (a) and (b). Click the icon to view the ANSUR data. a. Use a 0.05 significance level to test the claim that the mean weight of the 1988…arrow_forward
- solving problem 1arrow_forwardselect bmw stock. you can assume the price of the stockarrow_forwardThis problem is based on the fundamental option pricing formula for the continuous-time model developed in class, namely the value at time 0 of an option with maturity T and payoff F is given by: We consider the two options below: Fo= -rT = e Eq[F]. 1 A. An option with which you must buy a share of stock at expiration T = 1 for strike price K = So. B. An option with which you must buy a share of stock at expiration T = 1 for strike price K given by T K = T St dt. (Note that both options can have negative payoffs.) We use the continuous-time Black- Scholes model to price these options. Assume that the interest rate on the money market is r. (a) Using the fundamental option pricing formula, find the price of option A. (Hint: use the martingale properties developed in the lectures for the stock price process in order to calculate the expectations.) (b) Using the fundamental option pricing formula, find the price of option B. (c) Assuming the interest rate is very small (r ~0), use Taylor…arrow_forward
 Algebra for College StudentsAlgebraISBN:9781285195780Author:Jerome E. Kaufmann, Karen L. SchwittersPublisher:Cengage Learning
 Intermediate AlgebraAlgebraISBN:9781285195728Author:Jerome E. Kaufmann, Karen L. SchwittersPublisher:Cengage Learning
 Elementary AlgebraAlgebraISBN:9780998625713Author:Lynn Marecek, MaryAnne Anthony-SmithPublisher:OpenStax - Rice University
 Algebra: Structure And Method, Book 1AlgebraISBN:9780395977224Author:Richard G. Brown, Mary P. Dolciani, Robert H. Sorgenfrey, William L. ColePublisher:McDougal Littell
 Glencoe Algebra 1, Student Edition, 9780079039897...AlgebraISBN:9780079039897Author:CarterPublisher:McGraw Hill