
Concept explainers
Videos
Draw the products formed when cholesterol is treated with each reagent. Indicate the stereochemistry around any stereogenic centers in the product.
a.
b.
c. PCC
d. oleic acid,
e. [1]
(a)
Interpretation: The product formed on treatment of cholesterol with
Concept introduction: In the presence of base, the hydroxyl group loses its proton to form alkoxide. The alkoxide attacks on the carbonyl carbon of acyl chloride or anhydride to leading to the formation of acyl group and removal of chloride. This process is known as acylation.
Answer to Problem 31.28P
The product formed on treatment of cholesterol with
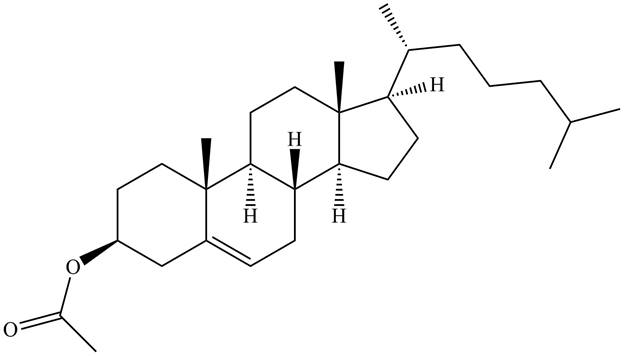
Figure 1
Explanation of Solution
In presence of base and acetyl chloride, the hydroxyl group of cholesterol undergoes acetylation. The corresponding chemical reaction is shown below.
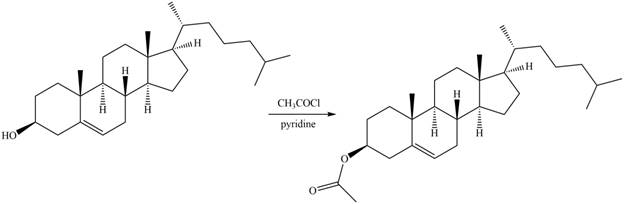
Figure 2
The product formed on treatment of cholesterol with
(b)
Interpretation: The product formed on treatment of cholesterol with
Concept introduction: The addition of
Answer to Problem 31.28P
The product formed on treatment of cholesterol with
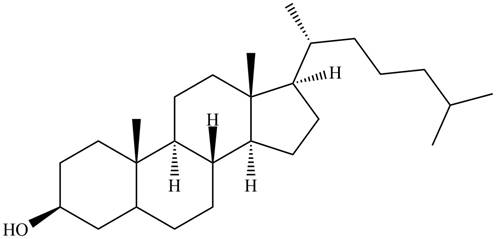
Figure 3
Explanation of Solution
In presence
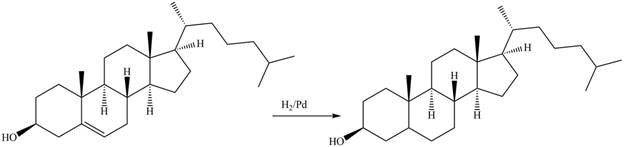
Figure 4
The product formed on treatment of cholesterol with
(c)
Interpretation: The product formed on treatment of cholesterol with PCC is to be predicted.
Concept introduction: Alcohols are oxidized to different carbonyl compounds depending upon the reagents and alcohol used. In presence of strong oxidizing reagents such as
Answer to Problem 31.28P
The product formed on treatment of cholesterol with PCC is,
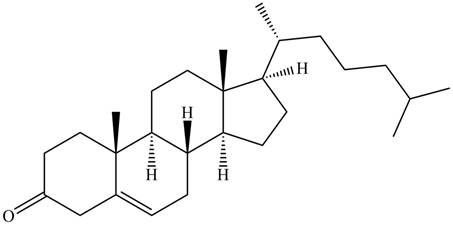
Figure 5
Explanation of Solution
On treatment of cholesterol with PCC, the secondary alcohol is oxidized to ketone. The corresponding chemical reaction is given below
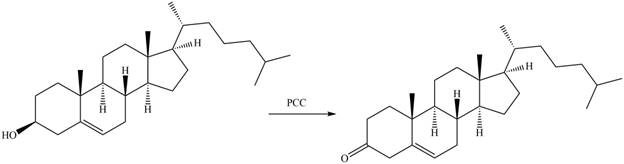
Figure 6
The product formed on treatment of cholesterol with PCC is shown in Figure 5.
(d)
Interpretation: The product formed on treatment of cholesterol with oleic acid,
Concept introduction: In presence of acid, the carboxylic acids are converted to ester using alcohols. This process is known as esterification.
Answer to Problem 31.28P
The product formed on treatment of cholesterol with oleic acid,
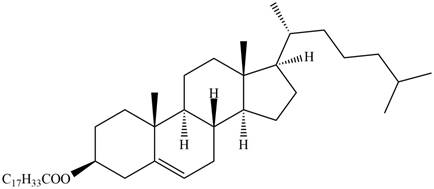
Figure 7
Explanation of Solution
In the presence of acid, the hydroxyl group of cholesterol reacts with oleic acid to form ester. The corresponding chemical reaction is shown below.
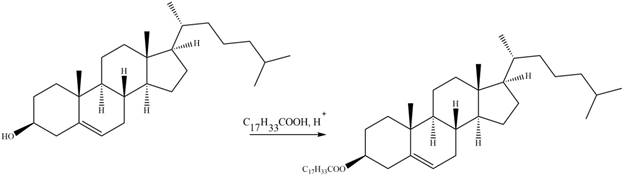
Figure 8
The product formed on treatment of cholesterol with oleic acid,
(e)
Interpretation: The product formed on treatment of cholesterol with 1.
Concept introduction: In the presence of borane, hydroperoxide and base the alkenes are converted to alcohols. In this reaction hydrogen atom and hydroxyl groups are added to the double bond. This reaction takes place in anti-markovnikov addition manner. This is a syn addition.
Answer to Problem 31.28P
The product formed on treatment of cholesterol with 1.
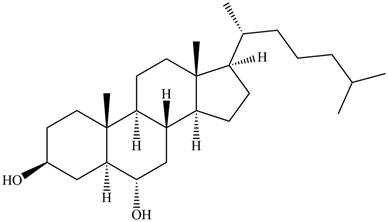
Figure 9
Explanation of Solution
In the presence of borane, hydroperoxide and base the double bond of cholesterol is oxidized to alcohol. The corresponding chemical reaction is shown below.
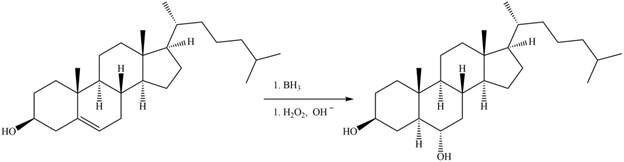
Figure 10
The product formed on treatment of cholesterol with 1.
Want to see more full solutions like this?
Chapter 31 Solutions
Package: Loose Leaf for Organic Chemistry with Biological Topics with Connect Access Card


- pressure (atm) 3 The pressure on a sample of pure X held at 47. °C and 0.88 atm is increased until the sample condenses. The pressure is then held constant and the temperature is decreased by 82. °C. On the phase diagram below draw a path that shows this set of changes. 0 0 200 temperature (K) 400 аarrow_forwarder your payment details | bar xb Home | bartleby x + aleksogi/x/isl.exe/1o u-lgNskr7j8P3jH-1Qs_pBanHhviTCeeBZbufuBYT0Hz7m7D3ZcW81NC1d8Kzb4srFik1OUFhKMUXzhGpw7k1 O States of Matter Sketching a described thermodynamic change on a phase diagram 0/5 The pressure on a sample of pure X held at 47. °C and 0.88 atm is increased until the sample condenses. The pressure is then held constant and the temperature is decreased by 82. °C. On the phase diagram below draw a path that shows this set of changes. pressure (atm) 1 3- 0- 0 200 Explanation Check temperature (K) 400 X Q Search L G 2025 McGraw Hill LLC. All Rights Reserved Terms of Use Privacy Cearrow_forward5.arrow_forward
- 6.arrow_forward0/5 alekscgi/x/sl.exe/1o_u-IgNglkr7j8P3jH-IQs_pBaHhvlTCeeBZbufuBYTi0Hz7m7D3ZcSLEFovsXaorzoFtUs | AbtAURtkqzol 1HRAS286, O States of Matter Sketching a described thermodynamic change on a phase diagram The pressure on a sample of pure X held at 47. °C and 0.88 atm is increased until the sample condenses. The pressure is then held constant and the temperature is decreased by 82. °C. On the phase diagram below draw a path that shows this set of changes. 3 pressure (atm) + 0- 0 5+ 200 temperature (K) 400 Explanation Check X 0+ F3 F4 F5 F6 F7 S 2025 McGraw Hill LLC All Rights Reserved. Terms of Use Privacy Center Accessibility Q Search LUCR + F8 F9 F10 F11 F12 * % & ( 5 6 7 8 9 Y'S Dele Insert PrtSc + Backsarrow_forward5.arrow_forward
- 9arrow_forwardalekscgi/x/lsl.exe/1o_u-IgNslkr7j8P3jH-IQs_pBanHhvlTCeeBZbufu BYTI0Hz7m7D3ZS18w-nDB10538ZsAtmorZoFusYj2Xu9b78gZo- O States of Matter Sketching a described thermodynamic change on a phase diagram 0/5 The pressure on a sample of pure X held at 47. °C and 0.88 atm is increased until the sample condenses. The pressure is then held constant and the temperature is decreased by 82. °C. On the phase diagram below draw a path that shows this set of changes. pressure (atm) 3- 200 temperature (K) Explanation Chick Q Sowncharrow_forward0+ aleksog/x/lsl.exe/1ou-lgNgkr7j8P3H-IQs pBaHhviTCeeBZbufuBYTOHz7m7D3ZStEPTBSB3u9bsp3Da pl19qomOXLhvWbH9wmXW5zm O States of Matter Sketching a described thermodynamic change on a phase diagram 0/5 Gab The temperature on a sample of pure X held at 0.75 atm and -229. °C is increased until the sample sublimes. The temperature is then held constant and the pressure is decreased by 0.50 atm. On the phase diagram below draw a path that shows this set of changes. F3 pressure (atm) 0- 0 200 Explanation temperature (K) Check F4 F5 ☀+ Q Search Chill Will an 9 ENG F6 F7 F8 F9 8 Delete F10 F11 F12 Insert PrtSc 114 d Ararrow_forward
- x + LEKS: Using a phase diagram a X n/alekscgi/x/lsl.exe/10_u-IgNsikr7j8P3jH-IQs_pBan HhvlTCeeBZbufu BYTI0Hz7m7D3ZcHYUt80XL-5alyVpw ○ States of Matter Using a phase diagram to find a phase transition temperature or pressure Use the phase diagram of Substance X below to find the melting point of X when the pressure above the solid is 1.1 atm. pressure (atm) 16 08- solid liquid- 0 200 400 gas 600 temperature (K) Note: your answer must be within 25 °C of the exact answer to be graded correct. × 5arrow_forwardS: Using a phase diagram leksogi/x/sl.exe/1ou-IgNs kr 7j8P3jH-IQs_pBan HhvTCeeBZbufuBYTI0Hz7m7D3ZdHYU+80XL-5alyVp O States of Matter Using a phase diagram to find a phase transition temperature or pressure se the phase diagram of Substance X below to find the boiling point of X when the pressure on the liquid is 1.6 atm. pressure (atm) 32- 16- solid liquid 0. gas 100 200 temperature (K) 300 Note: your answer must be within 12.5 °C of the exact answer to be graded correct. 10 Explanation Check § Q Search J 2025 McGraw Hill LLC. All Rights Researrow_forward151.2 254.8 85.9 199.6 241.4 87.6 242.5 186.4 155.8 257.1 242.9 253.3 256.0 216.6 108.7 239.0 149.7 236.4 152.1 222.7 148.7 278.2 268.7 234.4 262.7 283.2 143.6 QUESTION: Using this group of data on salt reduced tomato sauce concentration readings answer the following questions: 1. 95% Cl Confidence Interval (mmol/L) 2. [Na+] (mg/100 mL) 3. 95% Na+ Confidence Interval (mg/100 mL)arrow_forward
 Introduction to General, Organic and BiochemistryChemistryISBN:9781285869759Author:Frederick A. Bettelheim, William H. Brown, Mary K. Campbell, Shawn O. Farrell, Omar TorresPublisher:Cengage Learning