Videos
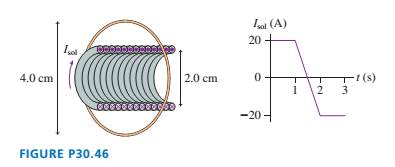
FIGURE P30.46 shows a 4.0-cm-diameter loop with resistance

Trending nowThis is a popular solution!

Chapter 30 Solutions
Physics for Scientists and Engineers: A Strategic Approach with Modern Physics, Books a la Carte Edition; Student Workbook for Physics for Scientists ... eText -- ValuePack Access Card (4th Edition)


- The figure shows a graph of the acceleration of an object as a function of the net force acting on it. The mass of this object, in grams, is closest to 11 a(m/s²) 8.0+ 6.0- 4.0- 2.0- 0+ F(N) 0.00 0.50 1.00 ☐ 130 ○ 8000 ☐ 89arrow_forwardValues that are within standard deviations represent measurements that are considered to be near the true value. Review the data from the lab and determine whether your data is within standard deviations. Report, using numerical values, whether your data for each angle is within standard deviations. An acceptable margin of error typically falls between 4% and 8% at the 95% confidence level. Review your data for each angle to determine whether the margin of error is within an acceptable range. Report with numerical values, whether your data for each angle is within an acceptable margin of error. Can you help explain what my data means in terms of the standard deviation and the ME? Thanks!arrow_forwardA sinusoidal wave is propagating along a stretched string that lies along the x-axis. The displacement of the string as a function of time is graphed in (Figure 1) for particles at x = 0 and at x = 0.0900 m. You are told that the two points x = 0 and x = 0.0900 m are within one wavelength of each other. If the wave is moving in the +x-direction, determine the wavelength. If instead the wave is moving in the -x-direction, determine the wavelength. Please show all stepsarrow_forward
- You are designing a two-string instrument with metal strings 35.0 cm long, as shown in (Figure 1). Both strings are under the same tension. String S1 has a mass of 8.30 g and produces the note middle C (frequency 262 Hz ) in its fundamental mode. What should be the tension in the string? What should be the mass of string S2 so that it will produce A-sharp (frequency 466 Hz ) as its fundamental? To extend the range of your instrument, you include a fret located just under the strings but not normally touching them. How far from the upper end should you put this fret so that when you press S1 tightly against it, this string will produce C-sharp (frequency 277 Hz ) in its fundamental? That is, what is x in the figure? If you press S2 against the fret, what frequency of sound will it produce in its fundamental?arrow_forwardPlease solve and answer the problem correctly please. Thank you!!arrow_forwardPlease help explain this. The experiment without the sandpaper had a 5% experimental error, with sandpaper it is 9.4%. Would the explaination be similar to the experiment without sandpaper? Thanks!arrow_forward
- A sinusoidal wave with wavelength 0.400 m travels along a string. The maximum transverse speed of a point on the string is 3.00 m/s and the maximum transverse acceleration is 8.10×10⁴m/s2. What is the propagation speed v of the wave? What is the amplitude A of the wave?arrow_forwardPlease help show how to find the standard deviation and margin of error. Please explain what they mean. Thanks!arrow_forwardPlease solve and answer the problem correctly please. Thank you!!arrow_forward
- Please solve and answer the question correctly please. Thank you!!arrow_forwardShould the results of your experimental Coefficient of Static Friction for the Wooden Block for the wooden block (Data Table 1) and the wooden block with the added mass (Data Table 2) be similar? Explain why or why not. Determine whether the results of the experiment are within a reasonable experimental error (< 10%) by calculating the % difference. Please help with showing how to calculate and with explaination, I'm not sure. Thanks!arrow_forwardNo chatgpt pls will upvote Alreadyarrow_forward

 Physics for Scientists and Engineers: Foundations...PhysicsISBN:9781133939146Author:Katz, Debora M.Publisher:Cengage Learning
 Glencoe Physics: Principles and Problems, Student...PhysicsISBN:9780078807213Author:Paul W. ZitzewitzPublisher:Glencoe/McGraw-Hill
 Physics for Scientists and EngineersPhysicsISBN:9781337553278Author:Raymond A. Serway, John W. JewettPublisher:Cengage Learning
 Physics for Scientists and Engineers with Modern ...PhysicsISBN:9781337553292Author:Raymond A. Serway, John W. JewettPublisher:Cengage Learning
 Physics for Scientists and Engineers, Technology ...PhysicsISBN:9781305116399Author:Raymond A. Serway, John W. JewettPublisher:Cengage Learning