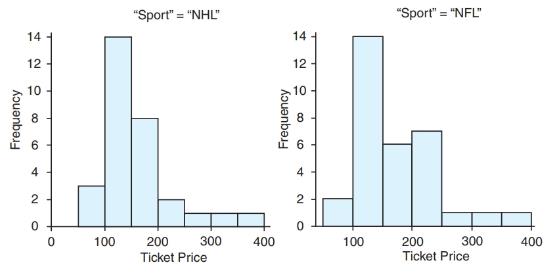
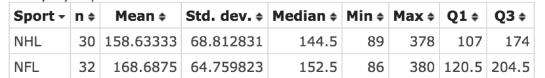
Professional Sports Ticket Prices The following histograms show ticket prices for professional hockey (NHL) and professional football (NFL) tickets. a. Based on the shape of the distributions, which measure of center should be used to compare the prices: the mean or the median ? b. Write a short report comparing the ticket prices for professional hockey and football. In your report comment on the typical ticket prices and the variability in ticket prices. Summary statistics for Ticket Price: Group by: Sport
Professional Sports Ticket Prices The following histograms show ticket prices for professional hockey (NHL) and professional football (NFL) tickets. a. Based on the shape of the distributions, which measure of center should be used to compare the prices: the mean or the median ? b. Write a short report comparing the ticket prices for professional hockey and football. In your report comment on the typical ticket prices and the variability in ticket prices. Summary statistics for Ticket Price: Group by: Sport
Solution Summary: The author identifies the measure of central tendency which can be used to compare the ticket prices for professional hockey and football.
Professional Sports Ticket Prices The following histograms show ticket prices for professional hockey (NHL) and professional football (NFL) tickets.
a. Based on the shape of the distributions, which measure of center should be used to compare the prices: the mean or the median?
b. Write a short report comparing the ticket prices for professional hockey and football. In your report comment on the typical ticket prices and the variability in ticket prices.
Harvard University
California Institute of Technology
Massachusetts Institute of Technology
Stanford University
Princeton University
University of Cambridge
University of Oxford
University of California, Berkeley
Imperial College London
Yale University
University of California, Los Angeles
University of Chicago
Johns Hopkins University
Cornell University
ETH Zurich
University of Michigan
University of Toronto
Columbia University
University of Pennsylvania
Carnegie Mellon University
University of Hong Kong
University College London
University of Washington
Duke University
Northwestern University
University of Tokyo
Georgia Institute of Technology
Pohang University of Science and Technology
University of California, Santa Barbara
University of British Columbia
University of North Carolina at Chapel Hill
University of California, San Diego
University of Illinois at Urbana-Champaign
National University of Singapore
McGill…
Name
Harvard University
California Institute of Technology
Massachusetts Institute of Technology
Stanford University
Princeton University
University of Cambridge
University of Oxford
University of California, Berkeley
Imperial College London
Yale University
University of California, Los Angeles
University of Chicago
Johns Hopkins University
Cornell University
ETH Zurich
University of Michigan
University of Toronto
Columbia University
University of Pennsylvania
Carnegie Mellon University
University of Hong Kong
University College London
University of Washington
Duke University
Northwestern University
University of Tokyo
Georgia Institute of Technology
Pohang University of Science and Technology
University of California, Santa Barbara
University of British Columbia
University of North Carolina at Chapel Hill
University of California, San Diego
University of Illinois at Urbana-Champaign
National University of Singapore…
A company found that the daily sales revenue of its flagship product follows a normal distribution with a mean of $4500 and a standard deviation of $450. The company defines a "high-sales day" that is, any day with sales exceeding $4800. please provide a step by step on how to get the answers in excel
Q: What percentage of days can the company expect to have "high-sales days" or sales greater than $4800?
Q: What is the sales revenue threshold for the bottom 10% of days? (please note that 10% refers to the probability/area under bell curve towards the lower tail of bell curve)
Provide answers in the yellow cells
Chapter 3 Solutions
Pearson eText Introductory Statistics: Exploring the World Through Data -- Instant Access (Pearson+)
Elementary Algebra For College Students (10th Edition)
Knowledge Booster
Learn more about
Need a deep-dive on the concept behind this application? Look no further. Learn more about this topic, statistics and related others by exploring similar questions and additional content below.


 Big Ideas Math A Bridge To Success Algebra 1: Stu...AlgebraISBN:9781680331141Author:HOUGHTON MIFFLIN HARCOURTPublisher:Houghton Mifflin Harcourt
 Glencoe Algebra 1, Student Edition, 9780079039897...AlgebraISBN:9780079039897Author:CarterPublisher:McGraw Hill
 Holt Mcdougal Larson Pre-algebra: Student Edition...AlgebraISBN:9780547587776Author:HOLT MCDOUGALPublisher:HOLT MCDOUGAL