Chain Restaurant Calories The New York Times collected data on the number of calories in meals at Chipotle restaurant. The distribution of calories was symmetric and unimodal and a graph of the distribution is shown below. a. Use the graph to estimate the mean number of calories in a Chipotle meal. b. One method for estimating the standard deviation of a symmetric uni-modal distribution is to approximate the range and then divide the range by 6. This is because nearly all the data should be within 3 standard deviations of the mean in each direction. Use this method to find an approximation of the standard deviation.
Chain Restaurant Calories The New York Times collected data on the number of calories in meals at Chipotle restaurant. The distribution of calories was symmetric and unimodal and a graph of the distribution is shown below. a. Use the graph to estimate the mean number of calories in a Chipotle meal. b. One method for estimating the standard deviation of a symmetric uni-modal distribution is to approximate the range and then divide the range by 6. This is because nearly all the data should be within 3 standard deviations of the mean in each direction. Use this method to find an approximation of the standard deviation.
Solution Summary: The author explains that the histogram shows the data on the number of calories in meals at Chipotle restaurant.
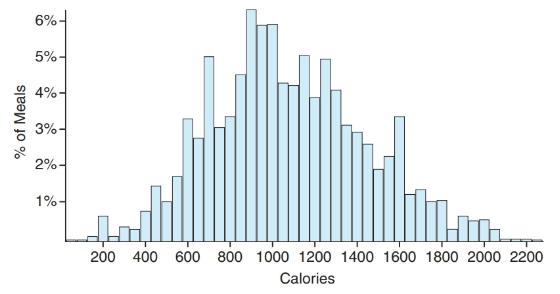
Chain Restaurant Calories The New York Times collected data on the number of calories in meals at Chipotle restaurant. The distribution of calories was symmetric and unimodal and a graph of the distribution is shown below.
a. Use the graph to estimate the mean number of calories in a Chipotle meal.
b. One method for estimating the standard deviation of a symmetric uni-modal distribution is to approximate the range and then divide the range by 6. This is because nearly all the data should be within 3 standard deviations of the mean in each direction. Use this method to find an approximation of the standard deviation.
Definition Definition Measure of central tendency that is the average of a given data set. The mean value is evaluated as the quotient of the sum of all observations by the sample size. The mean, in contrast to a median, is affected by extreme values. Very large or very small values can distract the mean from the center of the data. Arithmetic mean: The most common type of mean is the arithmetic mean. It is evaluated using the formula: μ = 1 N ∑ i = 1 N x i Other types of means are the geometric mean, logarithmic mean, and harmonic mean. Geometric mean: The nth root of the product of n observations from a data set is defined as the geometric mean of the set: G = x 1 x 2 ... x n n Logarithmic mean: The difference of the natural logarithms of the two numbers, divided by the difference between the numbers is the logarithmic mean of the two numbers. The logarithmic mean is used particularly in heat transfer and mass transfer. ln x 2 − ln x 1 x 2 − x 1 Harmonic mean: The inverse of the arithmetic mean of the inverses of all the numbers in a data set is the harmonic mean of the data. 1 1 x 1 + 1 x 2 + ...
NC Current Students - North Ce X | NC Canvas Login Links - North ( X
Final Exam Comprehensive x Cengage Learning
x
WASTAT - Final Exam - STAT
→
C
webassign.net/web/Student/Assignment-Responses/submit?dep=36055360&tags=autosave#question3659890_9
Part (b)
Draw a scatter plot of the ordered pairs.
N
Life
Expectancy
Life
Expectancy
80
70
600
50
40
30
20
10
Year of
1950
1970 1990
2010 Birth
O
Life
Expectancy
Part (c)
800
70
60
50
40
30
20
10
1950
1970 1990
W
ALT
林
$
#
4
R
J7
Year of
2010 Birth
F6
4+
80
70
60
50
40
30
20
10
Year of
1950 1970 1990
2010 Birth
Life
Expectancy
Ox
800
70
60
50
40
30
20
10
Year of
1950 1970 1990 2010 Birth
hp
P.B.
KA
&
7
80
% 5
H
A
B
F10
711
N
M
K
744
PRT SC
ALT
CTRL
Chapter 3 Solutions
Pearson eText Introductory Statistics: Exploring the World Through Data -- Instant Access (Pearson+)
Need a deep-dive on the concept behind this application? Look no further. Learn more about this topic, statistics and related others by exploring similar questions and additional content below.
Discrete Distributions: Binomial, Poisson and Hypergeometric | Statistics for Data Science; Author: Dr. Bharatendra Rai;https://www.youtube.com/watch?v=lHhyy4JMigg;License: Standard Youtube License


 Glencoe Algebra 1, Student Edition, 9780079039897...AlgebraISBN:9780079039897Author:CarterPublisher:McGraw Hill
 Big Ideas Math A Bridge To Success Algebra 1: Stu...AlgebraISBN:9781680331141Author:HOUGHTON MIFFLIN HARCOURTPublisher:Houghton Mifflin Harcourt
 Holt Mcdougal Larson Pre-algebra: Student Edition...AlgebraISBN:9780547587776Author:HOLT MCDOUGALPublisher:HOLT MCDOUGAL