Marvel Movies (Example 11 and 13) The top ten movies based on Marvel comic book characters for the U.S. box office as of fall 2017 are shown in the following table, with domestic gross rounded to the nearest hundred million. (Source: ultimatemovieranking.com) a. Sort the domestic gross income from smallest to largest. Find the median by averaging the two middle numbers. Interpret the median in context. b. Using the sorted data, find Q1 and Q3. Then find the interquartile range and interpret it in context. c. Find the range of the data. Explain why the IQR is preferred over the range as a measure of variability.
Marvel Movies (Example 11 and 13) The top ten movies based on Marvel comic book characters for the U.S. box office as of fall 2017 are shown in the following table, with domestic gross rounded to the nearest hundred million. (Source: ultimatemovieranking.com) a. Sort the domestic gross income from smallest to largest. Find the median by averaging the two middle numbers. Interpret the median in context. b. Using the sorted data, find Q1 and Q3. Then find the interquartile range and interpret it in context. c. Find the range of the data. Explain why the IQR is preferred over the range as a measure of variability.
Solution Summary: The author calculates the domestic gross income from the top ten movies based on Marvel comic book characters for the U.S. box office.
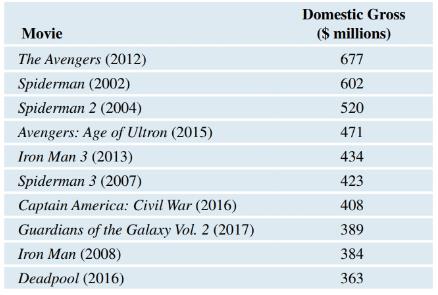
Marvel Movies (Example 11 and 13) The top ten movies based on Marvel comic book characters for the U.S. box office as of fall 2017 are shown in the following table, with domestic gross rounded to the nearest hundred million. (Source: ultimatemovieranking.com)
a. Sort the domestic gross income from smallest to largest. Find the median by averaging the two middle numbers. Interpret the median in context.
b. Using the sorted data, find Q1 and Q3. Then find the interquartile range and interpret it in context.
c. Find the range of the data. Explain why the IQR is preferred over the range as a measure of variability.
NC Current Students - North Ce X | NC Canvas Login Links - North ( X
Final Exam Comprehensive x Cengage Learning
x
WASTAT - Final Exam - STAT
→
C
webassign.net/web/Student/Assignment-Responses/submit?dep=36055360&tags=autosave#question3659890_9
Part (b)
Draw a scatter plot of the ordered pairs.
N
Life
Expectancy
Life
Expectancy
80
70
600
50
40
30
20
10
Year of
1950
1970 1990
2010 Birth
O
Life
Expectancy
Part (c)
800
70
60
50
40
30
20
10
1950
1970 1990
W
ALT
林
$
#
4
R
J7
Year of
2010 Birth
F6
4+
80
70
60
50
40
30
20
10
Year of
1950 1970 1990
2010 Birth
Life
Expectancy
Ox
800
70
60
50
40
30
20
10
Year of
1950 1970 1990 2010 Birth
hp
P.B.
KA
&
7
80
% 5
H
A
B
F10
711
N
M
K
744
PRT SC
ALT
CTRL
Harvard University
California Institute of Technology
Massachusetts Institute of Technology
Stanford University
Princeton University
University of Cambridge
University of Oxford
University of California, Berkeley
Imperial College London
Yale University
University of California, Los Angeles
University of Chicago
Johns Hopkins University
Cornell University
ETH Zurich
University of Michigan
University of Toronto
Columbia University
University of Pennsylvania
Carnegie Mellon University
University of Hong Kong
University College London
University of Washington
Duke University
Northwestern University
University of Tokyo
Georgia Institute of Technology
Pohang University of Science and Technology
University of California, Santa Barbara
University of British Columbia
University of North Carolina at Chapel Hill
University of California, San Diego
University of Illinois at Urbana-Champaign
National University of Singapore
McGill…
Name
Harvard University
California Institute of Technology
Massachusetts Institute of Technology
Stanford University
Princeton University
University of Cambridge
University of Oxford
University of California, Berkeley
Imperial College London
Yale University
University of California, Los Angeles
University of Chicago
Johns Hopkins University
Cornell University
ETH Zurich
University of Michigan
University of Toronto
Columbia University
University of Pennsylvania
Carnegie Mellon University
University of Hong Kong
University College London
University of Washington
Duke University
Northwestern University
University of Tokyo
Georgia Institute of Technology
Pohang University of Science and Technology
University of California, Santa Barbara
University of British Columbia
University of North Carolina at Chapel Hill
University of California, San Diego
University of Illinois at Urbana-Champaign
National University of Singapore…
Chapter 3 Solutions
Pearson eText Introductory Statistics: Exploring the World Through Data -- Instant Access (Pearson+)
Need a deep-dive on the concept behind this application? Look no further. Learn more about this topic, statistics and related others by exploring similar questions and additional content below.


 Glencoe Algebra 1, Student Edition, 9780079039897...AlgebraISBN:9780079039897Author:CarterPublisher:McGraw Hill
 Big Ideas Math A Bridge To Success Algebra 1: Stu...AlgebraISBN:9781680331141Author:HOUGHTON MIFFLIN HARCOURTPublisher:Houghton Mifflin Harcourt
 Holt Mcdougal Larson Pre-algebra: Student Edition...AlgebraISBN:9780547587776Author:HOLT MCDOUGALPublisher:HOLT MCDOUGAL