Major League Baseball Runs (Example 7) The histogram shows the number of runs scored by major league baseball teams for three seasons. The distribution is roughly unimodal and symmetric, with a mean of 687 and a standard deviation of 66 runs. An interval one standard deviation above and below the mean is marked on the histogram. a. According to the Empirical Rule , approximately what percent of the data should fall in the interval from 621 to 753 (that is, one standard deviation above and below the mean)? b. Use the histogram to estimate the actual percent of teams that fall in this interval. How did your estimate compare to the value predicted by the Empirical Rule? c. Between what two values would you expect to find about 95% of the teams?
Major League Baseball Runs (Example 7) The histogram shows the number of runs scored by major league baseball teams for three seasons. The distribution is roughly unimodal and symmetric, with a mean of 687 and a standard deviation of 66 runs. An interval one standard deviation above and below the mean is marked on the histogram. a. According to the Empirical Rule , approximately what percent of the data should fall in the interval from 621 to 753 (that is, one standard deviation above and below the mean)? b. Use the histogram to estimate the actual percent of teams that fall in this interval. How did your estimate compare to the value predicted by the Empirical Rule? c. Between what two values would you expect to find about 95% of the teams?
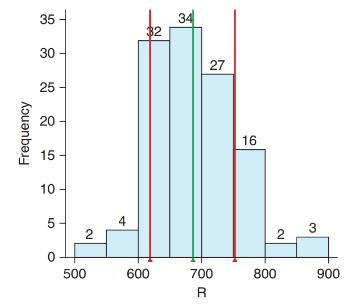
Major League Baseball Runs (Example 7) The histogram shows the number of runs scored by major league baseball teams for three seasons. The distribution is roughly unimodal and symmetric, with a mean of 687 and a standard deviation of 66 runs. An interval one standard deviation above and below the mean is marked on the histogram.
a. According to the Empirical Rule, approximately what percent of the data should fall in the interval from 621 to 753 (that is, one standard deviation above and below the mean)?
b. Use the histogram to estimate the actual percent of teams that fall in this interval. How did your estimate compare to the value predicted by the Empirical Rule?
c. Between what two values would you expect to find about 95% of the teams?
NC Current Students - North Ce X | NC Canvas Login Links - North ( X
Final Exam Comprehensive x Cengage Learning
x
WASTAT - Final Exam - STAT
→
C
webassign.net/web/Student/Assignment-Responses/submit?dep=36055360&tags=autosave#question3659890_9
Part (b)
Draw a scatter plot of the ordered pairs.
N
Life
Expectancy
Life
Expectancy
80
70
600
50
40
30
20
10
Year of
1950
1970 1990
2010 Birth
O
Life
Expectancy
Part (c)
800
70
60
50
40
30
20
10
1950
1970 1990
W
ALT
林
$
#
4
R
J7
Year of
2010 Birth
F6
4+
80
70
60
50
40
30
20
10
Year of
1950 1970 1990
2010 Birth
Life
Expectancy
Ox
800
70
60
50
40
30
20
10
Year of
1950 1970 1990 2010 Birth
hp
P.B.
KA
&
7
80
% 5
H
A
B
F10
711
N
M
K
744
PRT SC
ALT
CTRL
Harvard University
California Institute of Technology
Massachusetts Institute of Technology
Stanford University
Princeton University
University of Cambridge
University of Oxford
University of California, Berkeley
Imperial College London
Yale University
University of California, Los Angeles
University of Chicago
Johns Hopkins University
Cornell University
ETH Zurich
University of Michigan
University of Toronto
Columbia University
University of Pennsylvania
Carnegie Mellon University
University of Hong Kong
University College London
University of Washington
Duke University
Northwestern University
University of Tokyo
Georgia Institute of Technology
Pohang University of Science and Technology
University of California, Santa Barbara
University of British Columbia
University of North Carolina at Chapel Hill
University of California, San Diego
University of Illinois at Urbana-Champaign
National University of Singapore
McGill…
Name
Harvard University
California Institute of Technology
Massachusetts Institute of Technology
Stanford University
Princeton University
University of Cambridge
University of Oxford
University of California, Berkeley
Imperial College London
Yale University
University of California, Los Angeles
University of Chicago
Johns Hopkins University
Cornell University
ETH Zurich
University of Michigan
University of Toronto
Columbia University
University of Pennsylvania
Carnegie Mellon University
University of Hong Kong
University College London
University of Washington
Duke University
Northwestern University
University of Tokyo
Georgia Institute of Technology
Pohang University of Science and Technology
University of California, Santa Barbara
University of British Columbia
University of North Carolina at Chapel Hill
University of California, San Diego
University of Illinois at Urbana-Champaign
National University of Singapore…
Chapter 3 Solutions
Pearson eText Introductory Statistics: Exploring the World Through Data -- Instant Access (Pearson+)
Need a deep-dive on the concept behind this application? Look no further. Learn more about this topic, statistics and related others by exploring similar questions and additional content below.


 Glencoe Algebra 1, Student Edition, 9780079039897...AlgebraISBN:9780079039897Author:CarterPublisher:McGraw Hill
 Big Ideas Math A Bridge To Success Algebra 1: Stu...AlgebraISBN:9781680331141Author:HOUGHTON MIFFLIN HARCOURTPublisher:Houghton Mifflin Harcourt