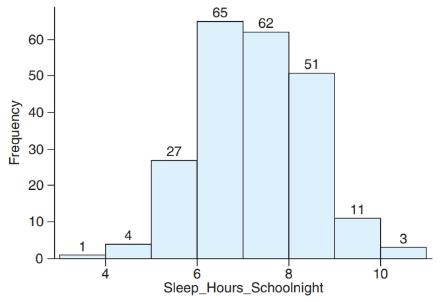
12th-Grade Sleep The histogram shows hours of sleep on a school night for a sample of 12th-grade students. a. Use the histogram and left-hand side of each bin to estimate the mean hours (to the nearest tenth) of sleep for 12th-graders on a school night. b. When comparing the mean and the median for this data set, would you expect these two values to be fairly similar or would you expect that one is much greater than the other? Explain.
12th-Grade Sleep The histogram shows hours of sleep on a school night for a sample of 12th-grade students. a. Use the histogram and left-hand side of each bin to estimate the mean hours (to the nearest tenth) of sleep for 12th-graders on a school night. b. When comparing the mean and the median for this data set, would you expect these two values to be fairly similar or would you expect that one is much greater than the other? Explain.
Solution Summary: The author explains how the histogram represents the hours of sleep on a school night for 12th grade students.
12th-Grade Sleep The histogram shows hours of sleep on a school night for a sample of 12th-grade students.
a. Use the histogram and left-hand side of each bin to estimate the mean hours (to the nearest tenth) of sleep for 12th-graders on a school night.
b. When comparing the mean and the median for this data set, would you expect these two values to be fairly similar or would you expect that one is much greater than the other? Explain.
Definition Definition Measure of central tendency that is the value that occurs most frequently in a data set. A data set may have more than one mode if multiple categories repeat an equal number of times. For example, in a data set with five item—3, 5, 5, 29, 473—the mode is 5 because it occurs twice and no other value occurs more than once. On a histogram or bar chart, the element with the highest bar represents the mode. Therefore, the mode is sometimes considered the most popular option. The mode is useful for nominal or categorical data (e.g., the most common color car that users purchase), but it is problematic for continuous data because it is more likely not to have any value that is more frequent than the other.
NC Current Students - North Ce X | NC Canvas Login Links - North ( X
Final Exam Comprehensive x Cengage Learning
x
WASTAT - Final Exam - STAT
→
C
webassign.net/web/Student/Assignment-Responses/submit?dep=36055360&tags=autosave#question3659890_9
Part (b)
Draw a scatter plot of the ordered pairs.
N
Life
Expectancy
Life
Expectancy
80
70
600
50
40
30
20
10
Year of
1950
1970 1990
2010 Birth
O
Life
Expectancy
Part (c)
800
70
60
50
40
30
20
10
1950
1970 1990
W
ALT
林
$
#
4
R
J7
Year of
2010 Birth
F6
4+
80
70
60
50
40
30
20
10
Year of
1950 1970 1990
2010 Birth
Life
Expectancy
Ox
800
70
60
50
40
30
20
10
Year of
1950 1970 1990 2010 Birth
hp
P.B.
KA
&
7
80
% 5
H
A
B
F10
711
N
M
K
744
PRT SC
ALT
CTRL
Harvard University
California Institute of Technology
Massachusetts Institute of Technology
Stanford University
Princeton University
University of Cambridge
University of Oxford
University of California, Berkeley
Imperial College London
Yale University
University of California, Los Angeles
University of Chicago
Johns Hopkins University
Cornell University
ETH Zurich
University of Michigan
University of Toronto
Columbia University
University of Pennsylvania
Carnegie Mellon University
University of Hong Kong
University College London
University of Washington
Duke University
Northwestern University
University of Tokyo
Georgia Institute of Technology
Pohang University of Science and Technology
University of California, Santa Barbara
University of British Columbia
University of North Carolina at Chapel Hill
University of California, San Diego
University of Illinois at Urbana-Champaign
National University of Singapore
McGill…
Name
Harvard University
California Institute of Technology
Massachusetts Institute of Technology
Stanford University
Princeton University
University of Cambridge
University of Oxford
University of California, Berkeley
Imperial College London
Yale University
University of California, Los Angeles
University of Chicago
Johns Hopkins University
Cornell University
ETH Zurich
University of Michigan
University of Toronto
Columbia University
University of Pennsylvania
Carnegie Mellon University
University of Hong Kong
University College London
University of Washington
Duke University
Northwestern University
University of Tokyo
Georgia Institute of Technology
Pohang University of Science and Technology
University of California, Santa Barbara
University of British Columbia
University of North Carolina at Chapel Hill
University of California, San Diego
University of Illinois at Urbana-Champaign
National University of Singapore…
Chapter 3 Solutions
Pearson eText Introductory Statistics: Exploring the World Through Data -- Instant Access (Pearson+)
Need a deep-dive on the concept behind this application? Look no further. Learn more about this topic, statistics and related others by exploring similar questions and additional content below.


 Big Ideas Math A Bridge To Success Algebra 1: Stu...AlgebraISBN:9781680331141Author:HOUGHTON MIFFLIN HARCOURTPublisher:Houghton Mifflin Harcourt
 Glencoe Algebra 1, Student Edition, 9780079039897...AlgebraISBN:9780079039897Author:CarterPublisher:McGraw Hill
 Holt Mcdougal Larson Pre-algebra: Student Edition...AlgebraISBN:9780547587776Author:HOLT MCDOUGALPublisher:HOLT MCDOUGAL