Laboratory measures of cardiovascular reactivity are receiving increasing attention. Much of the expanded interest is based on the belief that these measures, obtained under challenge from physical and psychological stressors, may yield a more biologically meaningful index of cardiovascular function than more traditional static measures. Typically, measurement of cardiovascular reactivity involves the use of an automated blood-pressure monitor to examine the changes in blood pressure before and after a stimulating experience (such as playing a video game). For this purpose, blood-pressure measurements were made with the Vita-Stat blood-pressure machine both before and after playing a video game. Similar measurements were obtained using manual methods for measuring blood pressure. A person was classified as a “reactor” if his or her DBP increased by 10 mm Hg or more after playing the game and as a nonreactor otherwise. The results are given in Table 3.11. TABLE 3.11 Classification of cardiovascular reactivity using an automated and a manual sphygmomanometer If the manual measurements are regarded as the “true” measure of reactivity, then what is the sensitivity of automated DBP measurements?
Laboratory measures of cardiovascular reactivity are receiving increasing attention. Much of the expanded interest is based on the belief that these measures, obtained under challenge from physical and psychological stressors, may yield a more biologically meaningful index of cardiovascular function than more traditional static measures. Typically, measurement of cardiovascular reactivity involves the use of an automated blood-pressure monitor to examine the changes in blood pressure before and after a stimulating experience (such as playing a video game). For this purpose, blood-pressure measurements were made with the Vita-Stat blood-pressure machine both before and after playing a video game. Similar measurements were obtained using manual methods for measuring blood pressure. A person was classified as a “reactor” if his or her DBP increased by 10 mm Hg or more after playing the game and as a nonreactor otherwise. The results are given in Table 3.11. TABLE 3.11 Classification of cardiovascular reactivity using an automated and a manual sphygmomanometer If the manual measurements are regarded as the “true” measure of reactivity, then what is the sensitivity of automated DBP measurements?
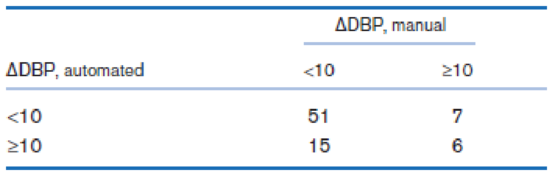
Solution Summary: The author calculates the probability that the symptom is present in the person given that they have a disease. The sensitivity of automated DBP measurements is 0.462.
Laboratory measures of cardiovascular reactivity are receiving increasing attention. Much of the expanded interest is based on the belief that these measures, obtained under challenge from physical and psychological stressors, may yield a more biologically meaningful index of cardiovascular function than more traditional static measures. Typically, measurement of cardiovascular reactivity involves the use of an automated blood-pressure monitor to examine the changes in blood pressure before and after a stimulating experience (such as playing a video game). For this purpose, blood-pressure measurements were made with the Vita-Stat blood-pressure machine both before and after playing a video game. Similar measurements were obtained using manual methods for measuring blood pressure. A person was classified as a “reactor” if his or her DBP increased by 10 mm Hg or more after playing the game and as a nonreactor otherwise. The results are given in Table 3.11.
TABLE 3.11 Classification of cardiovascular reactivity using an automated and a manual sphygmomanometer
If the manual measurements are regarded as the “true” measure of reactivity, then what is the sensitivity of automated DBP measurements?
Expression, rule, or law that gives the relationship between an independent variable and dependent variable. Some important types of functions are injective function, surjective function, polynomial function, and inverse function.
Elementary StatisticsBase on the same given data uploaded in module 4, will you conclude that the number of bathroom of houses is a significant factor for house sellprice? I your answer is affirmative, you need to explain how the number of bathroom influences the house price, using a post hoc procedure. (Please treat number of bathrooms as a categorical variable in this analysis)Base on the same given data, conduct an analysis for the variable sellprice to see if sale price is influenced by living area. Summarize your finding including all regular steps (learned in this module) for your method. Also, will you conclude that larger house corresponding to higher price (justify)?Each question need to include a spss or sas output.
Instructions:
You have to use SAS or SPSS to perform appropriate procedure: ANOVA or Regression based on the project data (provided in the module 4) and research question in the project file. Attach the computer output of all key steps (number) quoted in…
Elementary StatsBase on the given data uploaded in module 4, change the variable sale price into two categories: abovethe mean price or not; and change the living area into two categories: above the median living area ornot ( your two group should have close number of houses in each group). Using the resulting variables,will you conclude that larger house corresponding to higher price?Note: Need computer output, Ho and Ha, P and decision. If p is small, you need to explain what type ofdependency (association) we have using an appropriate pair of percentages.
Please include how to use the data in SPSS and interpretation of data.
An environmental research team is studying the daily rainfall (in millimeters) in a region over 100 days.
The data is grouped into the following histogram bins:
Rainfall Range (mm) Frequency
0-9.9
15
10 19.9
25
20-29.9
30
30-39.9
20
||40-49.9
10
a) If a random day is selected, what is the probability that the rainfall was at least 20 mm but less than 40
mm?
b) Estimate the mean daily rainfall, assuming the rainfall in each bin is uniformly distributed and the
midpoint of each bin represents the average rainfall for that range.
c) Construct the cumulative frequency distribution and determine the rainfall level below which 75% of the
days fall.
d) Calculate the estimated variance and standard deviation of the daily rainfall based on the histogram data.
Chapter 3 Solutions
WebAssign for Rosner's Fundamentals of Biostatistics, 8th Edition [Instant Access], Single-Term
Need a deep-dive on the concept behind this application? Look no further. Learn more about this topic, statistics and related others by exploring similar questions and additional content below.
![WebAssign for Rosner's Fundamentals of Biostatistics, 8th Edition [Instant Access], Single-Term](https://s3.amazonaws.com/compass-isbn-assets/textbook_empty_images/large_textbook_empty.svg)


 Glencoe Algebra 1, Student Edition, 9780079039897...AlgebraISBN:9780079039897Author:CarterPublisher:McGraw Hill
 Big Ideas Math A Bridge To Success Algebra 1: Stu...AlgebraISBN:9781680331141Author:HOUGHTON MIFFLIN HARCOURTPublisher:Houghton Mifflin Harcourt
 Functions and Change: A Modeling Approach to Coll...AlgebraISBN:9781337111348Author:Bruce Crauder, Benny Evans, Alan NoellPublisher:Cengage Learning