Obstetrics The following data are derived from the Monthly Vital Statistics Report (October 1999) issued by the National Center for Health Statistics [10]. These data are pertinent to livebirths only. Suppose that infants are classified as low birthweight if they have a birthweight <2500 g and as normal birthweight if they have a birthweight ≥2500 g. Suppose that infants are also classified by length of gestation in the following five categories: <28 weeks, 28–31 weeks, 32–35 weeks, 36 weeks, and ≥37 weeks. Assume the probabilities of the different periods of gestation are as given in Table 3.8. Also assume that the probability of low birthweight is .949 given a gestation of <28 weeks, .702 given a gestation of 28–31 weeks, .434 given a gestation of 32–35 weeks, .201 given a gestation of 36 weeks, and .029 given a gestation of ≥37 weeks. Table 3.8 Distribution of length of gestation Show that the events {length of gestation ≤ 31 weeks} and {low birthweight} are not independent.
Obstetrics The following data are derived from the Monthly Vital Statistics Report (October 1999) issued by the National Center for Health Statistics [10]. These data are pertinent to livebirths only. Suppose that infants are classified as low birthweight if they have a birthweight <2500 g and as normal birthweight if they have a birthweight ≥2500 g. Suppose that infants are also classified by length of gestation in the following five categories: <28 weeks, 28–31 weeks, 32–35 weeks, 36 weeks, and ≥37 weeks. Assume the probabilities of the different periods of gestation are as given in Table 3.8. Also assume that the probability of low birthweight is .949 given a gestation of <28 weeks, .702 given a gestation of 28–31 weeks, .434 given a gestation of 32–35 weeks, .201 given a gestation of 36 weeks, and .029 given a gestation of ≥37 weeks. Table 3.8 Distribution of length of gestation Show that the events {length of gestation ≤ 31 weeks} and {low birthweight} are not independent.
The following data are derived from the Monthly Vital Statistics Report (October 1999) issued by the National Center for Health Statistics [10]. These data are pertinent to livebirths only.
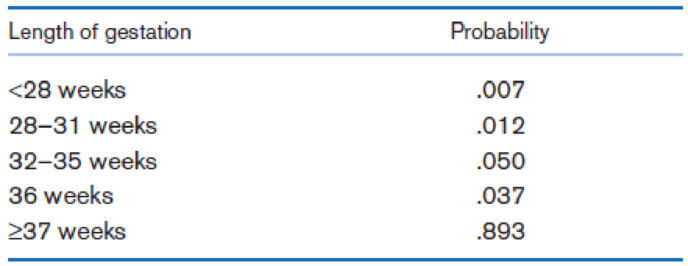
Suppose that infants are classified as low birthweight if they have a birthweight <2500 g and as normal birthweight if they have a birthweight ≥2500 g. Suppose that infants are also classified by length of gestation in the following five categories: <28 weeks, 28–31 weeks, 32–35 weeks, 36 weeks, and ≥37 weeks. Assume the probabilities of the different periods of gestation are as given in Table 3.8.
Also assume that the probability of low birthweight is .949 given a gestation of <28 weeks, .702 given a gestation of 28–31 weeks, .434 given a gestation of 32–35 weeks, .201 given a gestation of 36 weeks, and .029 given a gestation of ≥37 weeks.
Table 3.8 Distribution of length of gestation
Show that the events {length of gestation ≤ 31 weeks} and {low birthweight} are not independent.
Elementary StatisticsBase on the same given data uploaded in module 4, will you conclude that the number of bathroom of houses is a significant factor for house sellprice? I your answer is affirmative, you need to explain how the number of bathroom influences the house price, using a post hoc procedure. (Please treat number of bathrooms as a categorical variable in this analysis)Base on the same given data, conduct an analysis for the variable sellprice to see if sale price is influenced by living area. Summarize your finding including all regular steps (learned in this module) for your method. Also, will you conclude that larger house corresponding to higher price (justify)?Each question need to include a spss or sas output.
Instructions:
You have to use SAS or SPSS to perform appropriate procedure: ANOVA or Regression based on the project data (provided in the module 4) and research question in the project file. Attach the computer output of all key steps (number) quoted in…
Elementary StatsBase on the given data uploaded in module 4, change the variable sale price into two categories: abovethe mean price or not; and change the living area into two categories: above the median living area ornot ( your two group should have close number of houses in each group). Using the resulting variables,will you conclude that larger house corresponding to higher price?Note: Need computer output, Ho and Ha, P and decision. If p is small, you need to explain what type ofdependency (association) we have using an appropriate pair of percentages.
Please include how to use the data in SPSS and interpretation of data.
An environmental research team is studying the daily rainfall (in millimeters) in a region over 100 days.
The data is grouped into the following histogram bins:
Rainfall Range (mm) Frequency
0-9.9
15
10 19.9
25
20-29.9
30
30-39.9
20
||40-49.9
10
a) If a random day is selected, what is the probability that the rainfall was at least 20 mm but less than 40
mm?
b) Estimate the mean daily rainfall, assuming the rainfall in each bin is uniformly distributed and the
midpoint of each bin represents the average rainfall for that range.
c) Construct the cumulative frequency distribution and determine the rainfall level below which 75% of the
days fall.
d) Calculate the estimated variance and standard deviation of the daily rainfall based on the histogram data.
Chapter 3 Solutions
WebAssign for Rosner's Fundamentals of Biostatistics, 8th Edition [Instant Access], Single-Term
Need a deep-dive on the concept behind this application? Look no further. Learn more about this topic, statistics and related others by exploring similar questions and additional content below.
Continuous Probability Distributions - Basic Introduction; Author: The Organic Chemistry Tutor;https://www.youtube.com/watch?v=QxqxdQ_g2uw;License: Standard YouTube License, CC-BY
Probability Density Function (p.d.f.) Finding k (Part 1) | ExamSolutions; Author: ExamSolutions;https://www.youtube.com/watch?v=RsuS2ehsTDM;License: Standard YouTube License, CC-BY
Find the value of k so that the Function is a Probability Density Function; Author: The Math Sorcerer;https://www.youtube.com/watch?v=QqoCZWrVnbA;License: Standard Youtube License
![WebAssign for Rosner's Fundamentals of Biostatistics, 8th Edition [Instant Access], Single-Term](https://s3.amazonaws.com/compass-isbn-assets/textbook_empty_images/large_textbook_empty.svg)


 Glencoe Algebra 1, Student Edition, 9780079039897...AlgebraISBN:9780079039897Author:CarterPublisher:McGraw Hill
 College Algebra (MindTap Course List)AlgebraISBN:9781305652231Author:R. David Gustafson, Jeff HughesPublisher:Cengage Learning
 Holt Mcdougal Larson Pre-algebra: Student Edition...AlgebraISBN:9780547587776Author:HOLT MCDOUGALPublisher:HOLT MCDOUGAL
 Big Ideas Math A Bridge To Success Algebra 1: Stu...AlgebraISBN:9781680331141Author:HOUGHTON MIFFLIN HARCOURTPublisher:Houghton Mifflin Harcourt
 Functions and Change: A Modeling Approach to Coll...AlgebraISBN:9781337111348Author:Bruce Crauder, Benny Evans, Alan NoellPublisher:Cengage Learning
 Linear Algebra: A Modern IntroductionAlgebraISBN:9781285463247Author:David PoolePublisher:Cengage Learning