Cardiovascular Disease The ankle-arm blood-pressure index (AAI) is defined as the ratio of ankle systolic blood pressure/arm systolic blood pressure and is used for the diagnosis of lower extremity arterial disease. A study was conducted to investigate whether the AAI can be used as a screening test for atherosclerotic diseases in general [20]. The subjects were 446 male workers in a copper smelter in Japan. Each subject had an AAI determination as well as an electrocardiogram (ECG). From the ECG, an S-T segment depression was defined as an S-T segment ≥ 0.1 mV below the baseline in at least 1 of 12 leads in a resting ECG. S-T segment depression is often used as one characterization of an abnormal ECG. The data in Table 3.22 were presented relating AAI to S-T segment depression. Table 3.22 Association between ankle-arm blood-pressure index (AAI) and S-T segment depression Suppose the reproducibility of the AAI test were improved using better technology. Would the sensitivity of the test increase, decrease, or remain the same? why?
Cardiovascular Disease The ankle-arm blood-pressure index (AAI) is defined as the ratio of ankle systolic blood pressure/arm systolic blood pressure and is used for the diagnosis of lower extremity arterial disease. A study was conducted to investigate whether the AAI can be used as a screening test for atherosclerotic diseases in general [20]. The subjects were 446 male workers in a copper smelter in Japan. Each subject had an AAI determination as well as an electrocardiogram (ECG). From the ECG, an S-T segment depression was defined as an S-T segment ≥ 0.1 mV below the baseline in at least 1 of 12 leads in a resting ECG. S-T segment depression is often used as one characterization of an abnormal ECG. The data in Table 3.22 were presented relating AAI to S-T segment depression. Table 3.22 Association between ankle-arm blood-pressure index (AAI) and S-T segment depression Suppose the reproducibility of the AAI test were improved using better technology. Would the sensitivity of the test increase, decrease, or remain the same? why?
Solution Summary: The author explains the association between ankle-arm blood pressure index (AAI) test in not working properly. If another test or better technology is used for classifying the patients according to correct outcomes, the sensitivity value might increase.
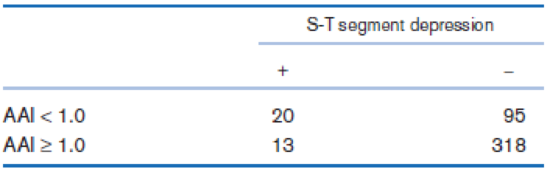
The ankle-arm blood-pressure index (AAI) is defined as the ratio of ankle systolic blood pressure/arm systolic blood pressure and is used for the diagnosis of lower extremity arterial disease. A study was conducted to investigate whether the AAI can be used as a screening test for atherosclerotic diseases in general [20]. The subjects were 446 male workers in a copper smelter in Japan. Each subject had an AAI determination as well as an electrocardiogram (ECG). From the ECG, an S-T segment depression was defined as an S-T segment ≥ 0.1 mV below the baseline in at least 1 of 12 leads in a resting ECG. S-T segment depression is often used as one characterization of an abnormal ECG. The data in Table 3.22 were presented relating AAI to S-T segment depression.
Table 3.22 Association between ankle-arm blood-pressure index (AAI) and S-T segment depression
Suppose the reproducibility of the AAI test were improved using better technology. Would the sensitivity of the test increase, decrease, or remain the same? why?
Elementary StatisticsBase on the same given data uploaded in module 4, will you conclude that the number of bathroom of houses is a significant factor for house sellprice? I your answer is affirmative, you need to explain how the number of bathroom influences the house price, using a post hoc procedure. (Please treat number of bathrooms as a categorical variable in this analysis)Base on the same given data, conduct an analysis for the variable sellprice to see if sale price is influenced by living area. Summarize your finding including all regular steps (learned in this module) for your method. Also, will you conclude that larger house corresponding to higher price (justify)?Each question need to include a spss or sas output.
Instructions:
You have to use SAS or SPSS to perform appropriate procedure: ANOVA or Regression based on the project data (provided in the module 4) and research question in the project file. Attach the computer output of all key steps (number) quoted in…
Elementary StatsBase on the given data uploaded in module 4, change the variable sale price into two categories: abovethe mean price or not; and change the living area into two categories: above the median living area ornot ( your two group should have close number of houses in each group). Using the resulting variables,will you conclude that larger house corresponding to higher price?Note: Need computer output, Ho and Ha, P and decision. If p is small, you need to explain what type ofdependency (association) we have using an appropriate pair of percentages.
Please include how to use the data in SPSS and interpretation of data.
An environmental research team is studying the daily rainfall (in millimeters) in a region over 100 days.
The data is grouped into the following histogram bins:
Rainfall Range (mm) Frequency
0-9.9
15
10 19.9
25
20-29.9
30
30-39.9
20
||40-49.9
10
a) If a random day is selected, what is the probability that the rainfall was at least 20 mm but less than 40
mm?
b) Estimate the mean daily rainfall, assuming the rainfall in each bin is uniformly distributed and the
midpoint of each bin represents the average rainfall for that range.
c) Construct the cumulative frequency distribution and determine the rainfall level below which 75% of the
days fall.
d) Calculate the estimated variance and standard deviation of the daily rainfall based on the histogram data.
Chapter 3 Solutions
WebAssign for Rosner's Fundamentals of Biostatistics, 8th Edition [Instant Access], Single-Term
Need a deep-dive on the concept behind this application? Look no further. Learn more about this topic, statistics and related others by exploring similar questions and additional content below.
Hypothesis Testing - Solving Problems With Proportions; Author: The Organic Chemistry Tutor;https://www.youtube.com/watch?v=76VruarGn2Q;License: Standard YouTube License, CC-BY
Hypothesis Testing and Confidence Intervals (FRM Part 1 – Book 2 – Chapter 5); Author: Analystprep;https://www.youtube.com/watch?v=vth3yZIUlGQ;License: Standard YouTube License, CC-BY
![WebAssign for Rosner's Fundamentals of Biostatistics, 8th Edition [Instant Access], Single-Term](https://s3.amazonaws.com/compass-isbn-assets/textbook_empty_images/large_textbook_empty.svg)


 Glencoe Algebra 1, Student Edition, 9780079039897...AlgebraISBN:9780079039897Author:CarterPublisher:McGraw Hill
 Holt Mcdougal Larson Pre-algebra: Student Edition...AlgebraISBN:9780547587776Author:HOLT MCDOUGALPublisher:HOLT MCDOUGAL
 Big Ideas Math A Bridge To Success Algebra 1: Stu...AlgebraISBN:9781680331141Author:HOUGHTON MIFFLIN HARCOURTPublisher:Houghton Mifflin Harcourt