Managerial Accounting: The Cornerstone of Business Decision-Making
7th Edition
ISBN: 9781337115773
Author: Maryanne M. Mowen, Don R. Hansen, Dan L. Heitger
Publisher: Cengage Learning
expand_more
expand_more
format_list_bulleted
Textbook Question
Chapter 3, Problem 56E
(Appendix 3A) Method of Least Squares Using Computer Spreadsheet Program
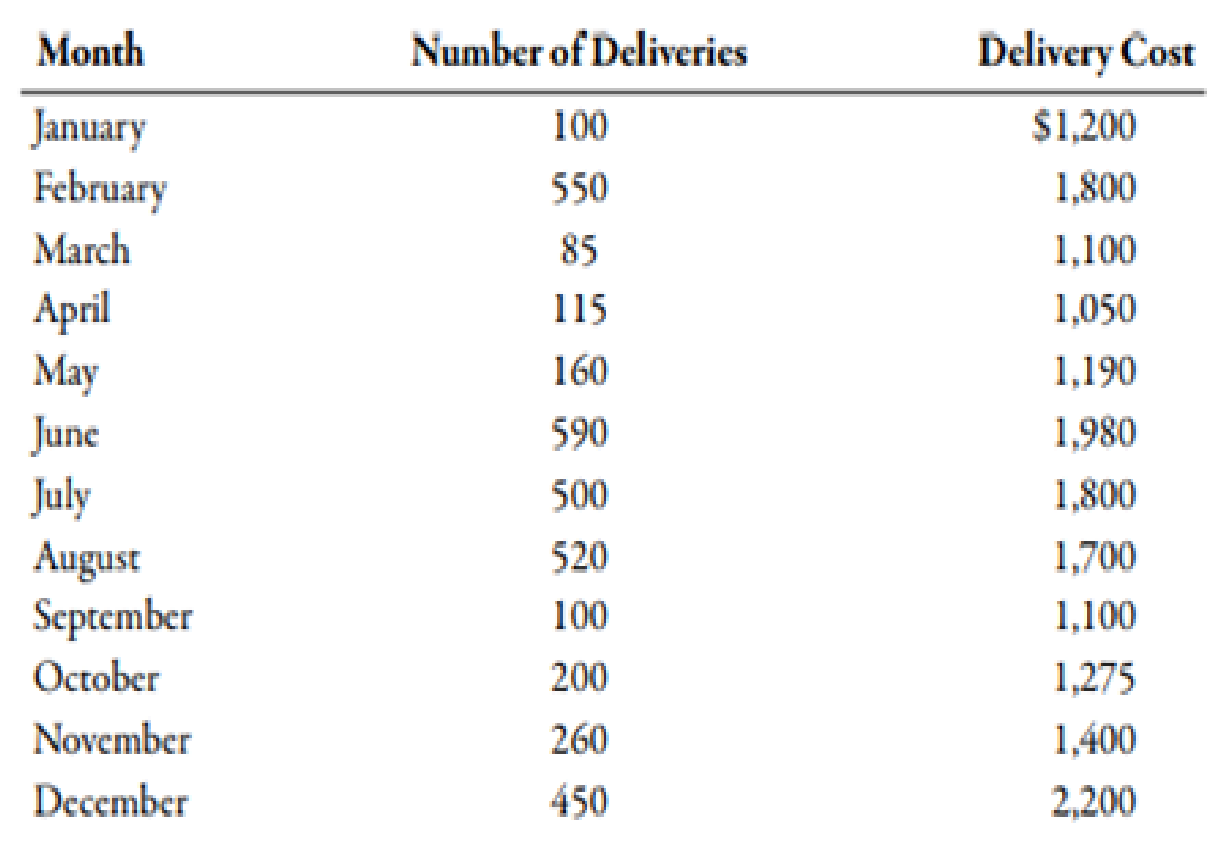
Susan Lewis, owner of a florist shop, is interested in predicting the cost of delivering floral arrangements. She collected monthly data on the number of deliveries and the total monthly delivery cost (
Required:
- 1. Using a computer spreadsheet program such as Excel, run a regression on these data. Print out your results.
- 2. Using your results from Requirement 1, write the cost formula for delivery cost. (Note: Round the fixed cost to the nearest dollar and the variable rate to the nearest cent.)
- 3. CONCEPTUAL CONNECTION What is R2 based on your results? Do you think that the number of direct labor hours is a good predictor of delivery cost?
- 4. Using the cost formula in Requirement 2, what would predicted delivery cost be for a month with 300 deliveries?
Expert Solution & Answer
Trending nowThis is a popular solution!
Students have asked these similar questions
For TVM calculator: Write each known variable’s value as it appears in the calculator and use a question mark for the missing variable. Then, in the space provided write the missing variable’s value, as it appears in the calculator. Finally, write your final answer in context, with units, as a complete sentence.
Greg has been making regular monthly payments of $425 into an account for 15 years, and he now has $96,000. What is the annual interest rate of his account?
N=180 I= ? PV=96,000 PMT= 425 FV= ? P/Y= 12 C/Y=12
Missing Variable Value __________________
Context Sentence:
Use the assumptions below to create calculations to determine annual and monthly revenue projections for each of the categories. Be sure to make the revenue category on the pro-forma view (above) descriptive and use your assumptions as drivers for the values calculated. Make it easy to change the assumptions to determine the impact of a change (up or down) in volume, rates and discounts. Insert lines or columns as needed.
Camps and Schools require physicals before kids arrive. There are 150 camper physicals spread evenly in May and June. There are 500 school physicals, 25% in July, 65% in August, and 10% in September. The insurance companies in covering families in your community are split 50% BC/BS and 40% United Healthcare and no insurance (private pay). Your normal camper physical charge is $115. You give BC/BS an 18% discount and United Health care a 15% discount. The special promotion for campers without insurance (private pay) is $75.
Camper Physical
$ 115
Payor -…
Tom uses his computer to calculate the following regression formula:Weekly total costs = $18,791 + ($19.97 * Number of orders per week) Draw the regression line on your graph. Use your graph to evaluate the regression line using the criteria of economic plausibility, goodness of fit, and significance of the independent variable. Is the cost function estimated using the high-low method a close approximation of the cost function estimated using the regression method? Explain briefly.
Chapter 3 Solutions
Managerial Accounting: The Cornerstone of Business Decision-Making
Ch. 3 - Prob. 1DQCh. 3 - What is a driver? Give an example of a cost and...Ch. 3 - Suppose a company finds that shipping cost is...Ch. 3 - Some firms assign mixed costs to either the fixed...Ch. 3 - Explain the difference between committed and...Ch. 3 - Explain why the concept of relevant range is...Ch. 3 - Why do mixed costs pose a problem when it comes to...Ch. 3 - Describe the cost formula for a strictly fixed...Ch. 3 - Describe the cost formula for a strictly variable...Ch. 3 - What is the scattergraph method, and why is it...
Ch. 3 - Describe how the scattergraph method breaks out...Ch. 3 - What are the advantages of the scattergraph method...Ch. 3 - Prob. 13DQCh. 3 - What is meant by the best-fitting line?Ch. 3 - What is the difference between the unit cost of a...Ch. 3 - Prob. 16DQCh. 3 - (Appendix 3A) Explain the meaning of the...Ch. 3 - A factor that causes or leads to a change in a...Ch. 3 - Which of the following would probably be a...Ch. 3 - Prob. 3MCQCh. 3 - In the cost formula, the term 128,000,000 a. is...Ch. 3 - In the cost formula, the term 12,000 a. is the...Ch. 3 - Prob. 6MCQCh. 3 - Prob. 7MCQCh. 3 - The following cost formula for total purchasing...Ch. 3 - An advantage of the high-low method is that it a....Ch. 3 - Prob. 10MCQCh. 3 - Prob. 11MCQCh. 3 - Prob. 12MCQCh. 3 - The total cost for monthly supervisory cost in a...Ch. 3 - Yates Company shows the following unit costs for...Ch. 3 - (Appendix 3A) In the method of least squares, the...Ch. 3 - Creating and Using a Cost Formula Big Thumbs...Ch. 3 - Using High-Low to Calculate Fixed Cost, Calculate...Ch. 3 - Using High-Low to Calculate Predicted Total...Ch. 3 - Using High-Low to Calculate Predicted Total...Ch. 3 - Using Regression to Calculate Fixed Cost,...Ch. 3 - Inventory Valuation under Absorption Costing Refer...Ch. 3 - Inventory Valuation under Variable Costing Refer...Ch. 3 - Absorption-Costing Income Statement Refer to the...Ch. 3 - Variable-Costing Income Statement Refer to the...Ch. 3 - Creating and Using a Cost Formula Kleenaire Motors...Ch. 3 - Using High-Low to Calculate Fixed Cost, Calculate...Ch. 3 - Using High-Low to Calculate Predicted Total...Ch. 3 - Brief Exercise 3-28 Using High-Low to Calculate...Ch. 3 - Using Regression to Calculate Fixed Cost,...Ch. 3 - Inventory Valuation under Absorption Costing Refer...Ch. 3 - Inventory Valuation under Variable Costing Refer...Ch. 3 - Brief Exercise 3-32 Absorption-Costing Income...Ch. 3 - Brief Exercise 3-33 Variable-Costing Income...Ch. 3 - Variable and Fixed Costs What follows are a number...Ch. 3 - Cost Behavior, Classification Smith Concrete...Ch. 3 - Prob. 36ECh. 3 - Prob. 37ECh. 3 - Prob. 38ECh. 3 - Step Costs, Relevant Range Bellati Inc. produces...Ch. 3 - Matching Cost Behavior Descriptions to Cost...Ch. 3 - Examine the graphs in Exercise 3-40. Required: As...Ch. 3 - Prob. 42ECh. 3 - Prob. 43ECh. 3 - High-Low Method Refer to the information for Luisa...Ch. 3 - Scattergraph Method Refer to the information for...Ch. 3 - Method of Least Squares Refer to the information...Ch. 3 - Use the following information for Exercises 3-47...Ch. 3 - Use the following information for Exercises 3-47...Ch. 3 - Method of Least Squares, Developing and Using the...Ch. 3 - The method of least squares was used to develop a...Ch. 3 - Identifying the Parts of the Cost Formula;...Ch. 3 - Inventory Valuation under Absorption Costing...Ch. 3 - Inventory Valuation under Variable Costing Lane...Ch. 3 - Income Statements under Absorption and Variable...Ch. 3 - (Appendix 3A) Method of Least Squares Using...Ch. 3 - (Appendix 3A) Method of Least Squares Using...Ch. 3 - Identifying Fixed, Variable, Mixed, and Step Costs...Ch. 3 - Identifying Use of the High-Low, Scattergraph, and...Ch. 3 - Identifying Variable Costs, Committed Fixed Costs,...Ch. 3 - Scattergraph, High-Low Method, and Predicting Cost...Ch. 3 - Method of Least Squares, Predicting Cost for...Ch. 3 - Cost Behavior, High-Low Method, Pricing Decision...Ch. 3 - Prob. 63PCh. 3 - Variable and Fixed Costs, Cost Formula, High-Low...Ch. 3 - Cost Separation About 8 years ago, Kicker faced...Ch. 3 - Variable-Costing and Absorption-Costing Income...Ch. 3 - Refer to the information for Farnsworth Company...Ch. 3 - (Appendix 3A) Scattergraph, High-Low Method,...Ch. 3 - (Appendix 3A) Separating Fixed and Variable Costs,...Ch. 3 - (Appendix 3A) Cost Formulas, Single and Multiple...Ch. 3 - Suspicious Acquisition of Data, Ethical Issues...
Knowledge Booster
Learn more about
Need a deep-dive on the concept behind this application? Look no further. Learn more about this topic, accounting and related others by exploring similar questions and additional content below.Similar questions
- A marketing professor at Givens College is interested in the relationship between hours spent studying and total points earned in a course. Data collected on 156 students who took the course last semester are provided in the tile MktHrsPts. Develop a scatter chart for these data. What does the scatter chart indicate about the relationship between total points earned and hours spent studying? Develop an estimated regression equation showing how total points earned is related to hours spent studying. What is the estimated regression model? Test whether each of the regression parameters β0 and β1 is equal to zero at a 0.01 level of significance. What are the correct interpretations of the estimated regression parameters? Are these interpretations reasonable? How much of the variation in the sample values of total point earned does the model you estimated in part (b) explain? Mark Sweeney spent 95 hours studying. Use the regression model you estimated in part (b) to predict the total points Mark earned.arrow_forwardConsider again the example introduced in Section 7.5 of a credit card company that has a database of information provided by its customers when they apply for credit cards. An analyst has created a multiple regression model for which the dependent variable in the model is credit card charges accrued by a customer in the data set over the past year (y), and the independent variables are the customers annual household income (x1), number of members of the household (x2), and number of years of post-high school education (x3). Figure 7.23 provides Excel output for a multiple regression model estimated using a data set the company created. a. Estimate the corresponding simple linear regression with the customers annual household income as the independent variable and credit card charges accrued by a customer over the past year as the dependent variable. Interpret the estimated relationship between the customers annual household income and credit card charges accrued over the past year. How much variation in credit card charges accrued by a customer over the past year is explained by this simple linear regression model? b. Estimate the corresponding simple linear regression with the number of members in the customers household as the independent variable and credit card charges accrued by a customer over the past year as the dependent variable. Interpret the estimated relationship between the number of members in the customers household and credit card charges accrued over the past year. How much variation in credit card charges accrued by a customer over the past year is explained by this simple linear regression model? c. Estimate the corresponding simple linear regression with the customers number of years of posthigh school education as the independent variable and credit card charges accrued by a customer over the past year as the dependent variable. Interpret the estimated relationship between the customers number of years of posthigh school education and credit card charges accrued over the past year. How much variation in credit card charges accrued by a customer over the past year is explained by this simple linear regression model? d. Recall the multiple regression in Figure 7.23 with credit card charges accrued by a customer over the past year as the dependent variable and customers annual household income (x1), number of members of the household (x2), and number of years of post-high school education (x3) as the independent variables. Do the estimated slopes differ substantially from the corresponding slopes that were estimated using simple linear regression in parts (a), (b), and (c)? What does this tell you about multicollinearity in the multiple regression model in Figure 7.23? e. Add the coefficients of determination for the simple linear regression in parts (a), (b), and (c), and compare the result to the coefficient of determination for the multiple regression model in Figure 7.23. What does this tell you about multicollinearity in the multiple regression model in Figure 7.23? f. Add age, a dummy variable for sex, and a dummy variable for whether a customer has exceeded his or her credit limit in the past 12 months as independent variables to the multiple regression model in Figure 7.23. Code the dummy variable for sex as 1 if the customer is female and 0 if male, and code the dummy variable for whether a customer has exceeded his or her credit limit in the past 12 months as 1 if the customer has exceeded his or her credit limit in the past 12 months and 0 otherwise. Do these variables substantially improve the fit of your model?arrow_forwardA sociologist was hired by a large city hospital to investigate the relationship between the number of unauthorized days that employees are absent per year and the distance (miles) between home and work for the employees. A sample of 10 employees was chosen, and the following data were collected. a. Develop a scatter chart for these data. Does a linear relationship appear reasonable? Explain. b. Use the data to develop an estimated regression equation that could be used to predict the number of days absent given the distance to work. What is the estimated regression model? c. What is the 99% confidence interval for the regression parameter 1? Based on this interval, what conclusion can you make about the hypotheses that the regression parameter 1 is equal to zero? d. What is the 99% confidence interval for the regression parameter 0? Based on this interval, what conclusion can you make about the hypotheses that the regression parameter 0 is equal to zero? e. How much of the variation in the sample values of number of days absent does the model you estimated in part (b) explain?arrow_forward
- The owner of an automobile repair shop studied the waiting times for customers who arrive at the shop for an oil change. The following data with waiting times in minutes were collected over a 1-month period. 2 5 10 12 4 4 5 17 11 8 9 8 12 21 6 8 7 13 18 3 Using classes of 04, 59, and so on, show: a. The frequency distribution. b. The relative frequency distribution. c. The cumulative frequency distribution. d. The cumulative relative frequency distribution. e. The proportion of customers needing an oil change who wait 9 minutes or less.arrow_forwardUse the TVM Solver to answer the following questions. Write each known variable's value as it appears in the calculator and use a question mark for the missing variable. Then, in the space provided write the missing variable's value, as it appears in the calculator. Finally, write your final answer in context, with units, as a complete sentence. Round to three decimals or by context. 1. Thomas plans to invest $3,400 into a money market account with a 6% annual interest rate compounded weekly. How much will be in the account after 9 years? Variable Value N = 1% = PV = PMT= FV = PY = CY = What is the Missing Variable Unit? Write a Context Sentence:arrow_forwardRecent monthly costs of providing on-board flight service incurred by Great Plains Airlines are shown in the following table. Required:1. Build a spreadsheet: Construct an Excel spreadsheet and use the Excel commands to perform a least-squares regression. Estimate the cost behavior of the airline’s on-board flight service. Express the cost behavior in equation form.2. Use Excel to calculate and interpret the R2 value for the regression.arrow_forward
- After a few hours May’s computer is fixed. May uses the first 9 months of data and regression analysis to estimate the relationship between the quantity purchased and purchase costs of part #696. The regression line May obtains is as follows: y = $2,582.6 + 3.54X Evaluate the regression line using the criteria of economic plausibility, goodness of fit, and significance of the independent variable. Compare the regression equation to the equation based on the high-low method. Which is a better fit? Why?arrow_forwardWhat would be the best equation using the high-low method?arrow_forwardWrite each known variable’s value as it appears in the calculator and use a question mark for the missing variable. Then, in the space provided write the missing variable’s value, as it appears in the calculator. Finally, write your final answer in context, with units, as a complete sentence. Use a TVM Solver is necessary. Daniel plans on making monthly payments into an account that earns 3.5% compounded monthly. If he wants $15,000 in 20 years, what do his payments need to be? N _____________ I%_____________ Missing Variable Value_______________________ PV_____________ PMT____________ Context Sentence: FV______________ P/Y_____________ C/Y_____________arrow_forward
- The managing director of a consulting group has the accompanying monthly data on total overhead costs and professional labor hours to bill to clients. Complete parts a through c. Click the icon to view the monthly data. a. Develop a simple linear regression model between billable hours and overhead costs. Overhead Costs +(9) x Billable Hours (Round the constant to one decimal place as needed. Round the coefficient to four decimal places as needed. Do not include the $ symbol in your answers.) X Monthly Overhead Costs and Billable Hours Data Overhead Costs Billable Hours $315,000 3,000 $360,000 4,000 $385,000 5,000 $438,000 6,000 $520,000 7,000 $540,000 8,000 D Print Donearrow_forwardPlease provide answerarrow_forwardThe Paymore Rental Car Agency rents cars in a small town. It wants to determine how many rental cars it should maintain. Based on market projections and historical data, the manager has determined probability distributions for the number of rentals per day and rental duration (in days only) as shown in the following tables: Number of customers per day Probability 0 .20 1 .20 2 .50 3 .10 Rental duration in days Probability 1 .10 2 .30 3 .40 4 .10 5 .10 Design a simulation experiment for the car agency and simulate using a fleet of four rental cars for 10 days. Compute the probability that the agency will not have a car available upon demand. Should the agency expand its fleet? Explain how a simulation experiment could be designed to determine the optimal fleet size for the Paymore Agency. Use the following random numbers in order (from left to right) for the simulation of number of customers per day: 0.62 0.48 0.96 0.86 0.86 0.29 0.79 0.22 0.08 0.62…arrow_forward
arrow_back_ios
SEE MORE QUESTIONS
arrow_forward_ios
Recommended textbooks for you
- Managerial Accounting: The Cornerstone of Busines...AccountingISBN:9781337115773Author:Maryanne M. Mowen, Don R. Hansen, Dan L. HeitgerPublisher:Cengage LearningCornerstones of Cost Management (Cornerstones Ser...AccountingISBN:9781305970663Author:Don R. Hansen, Maryanne M. MowenPublisher:Cengage LearningEssentials of Business Analytics (MindTap Course ...StatisticsISBN:9781305627734Author:Jeffrey D. Camm, James J. Cochran, Michael J. Fry, Jeffrey W. Ohlmann, David R. AndersonPublisher:Cengage Learning
- Excel Applications for Accounting PrinciplesAccountingISBN:9781111581565Author:Gaylord N. SmithPublisher:Cengage LearningPrinciples of Accounting Volume 2AccountingISBN:9781947172609Author:OpenStaxPublisher:OpenStax CollegeEssentials Of Business AnalyticsStatisticsISBN:9781285187273Author:Camm, Jeff.Publisher:Cengage Learning,
Managerial Accounting: The Cornerstone of Busines...
Accounting
ISBN:9781337115773
Author:Maryanne M. Mowen, Don R. Hansen, Dan L. Heitger
Publisher:Cengage Learning
Cornerstones of Cost Management (Cornerstones Ser...
Accounting
ISBN:9781305970663
Author:Don R. Hansen, Maryanne M. Mowen
Publisher:Cengage Learning
Essentials of Business Analytics (MindTap Course ...
Statistics
ISBN:9781305627734
Author:Jeffrey D. Camm, James J. Cochran, Michael J. Fry, Jeffrey W. Ohlmann, David R. Anderson
Publisher:Cengage Learning
Excel Applications for Accounting Principles
Accounting
ISBN:9781111581565
Author:Gaylord N. Smith
Publisher:Cengage Learning
Principles of Accounting Volume 2
Accounting
ISBN:9781947172609
Author:OpenStax
Publisher:OpenStax College
Essentials Of Business Analytics
Statistics
ISBN:9781285187273
Author:Camm, Jeff.
Publisher:Cengage Learning,
How to Estimate Project Costs: A Method for Cost Estimation; Author: Online PM Courses - Mike Clayton;https://www.youtube.com/watch?v=YQ2Wi3Jh3X0;License: Standard Youtube License