Concept explainers
At the Hard Rock Cafe, like many organizations, project management is a key planning took With Hard Rock’s constant growth in hotels and cafes, remodeling of existing cafes,
“Without Microsoft Project,” says Hard Rock Vice-President Chris Tomasso, “there is no way to keep so many people on the same page.” Tomasso is in charge of the Rockfest event, which is attended by well over 100,000 enthusiastic fans. The challenge is pulling it off within a tight 9-month planning horizon. As the event approaches, Tomasso devotes greater energy to its activities. For the first 3 months, Tomasso updates his Microsoft Project charts monthly. Then at the 6-month mark, he updates his progress weekly. At the 9-month mark, he checks and corrects his schedule twice a week.
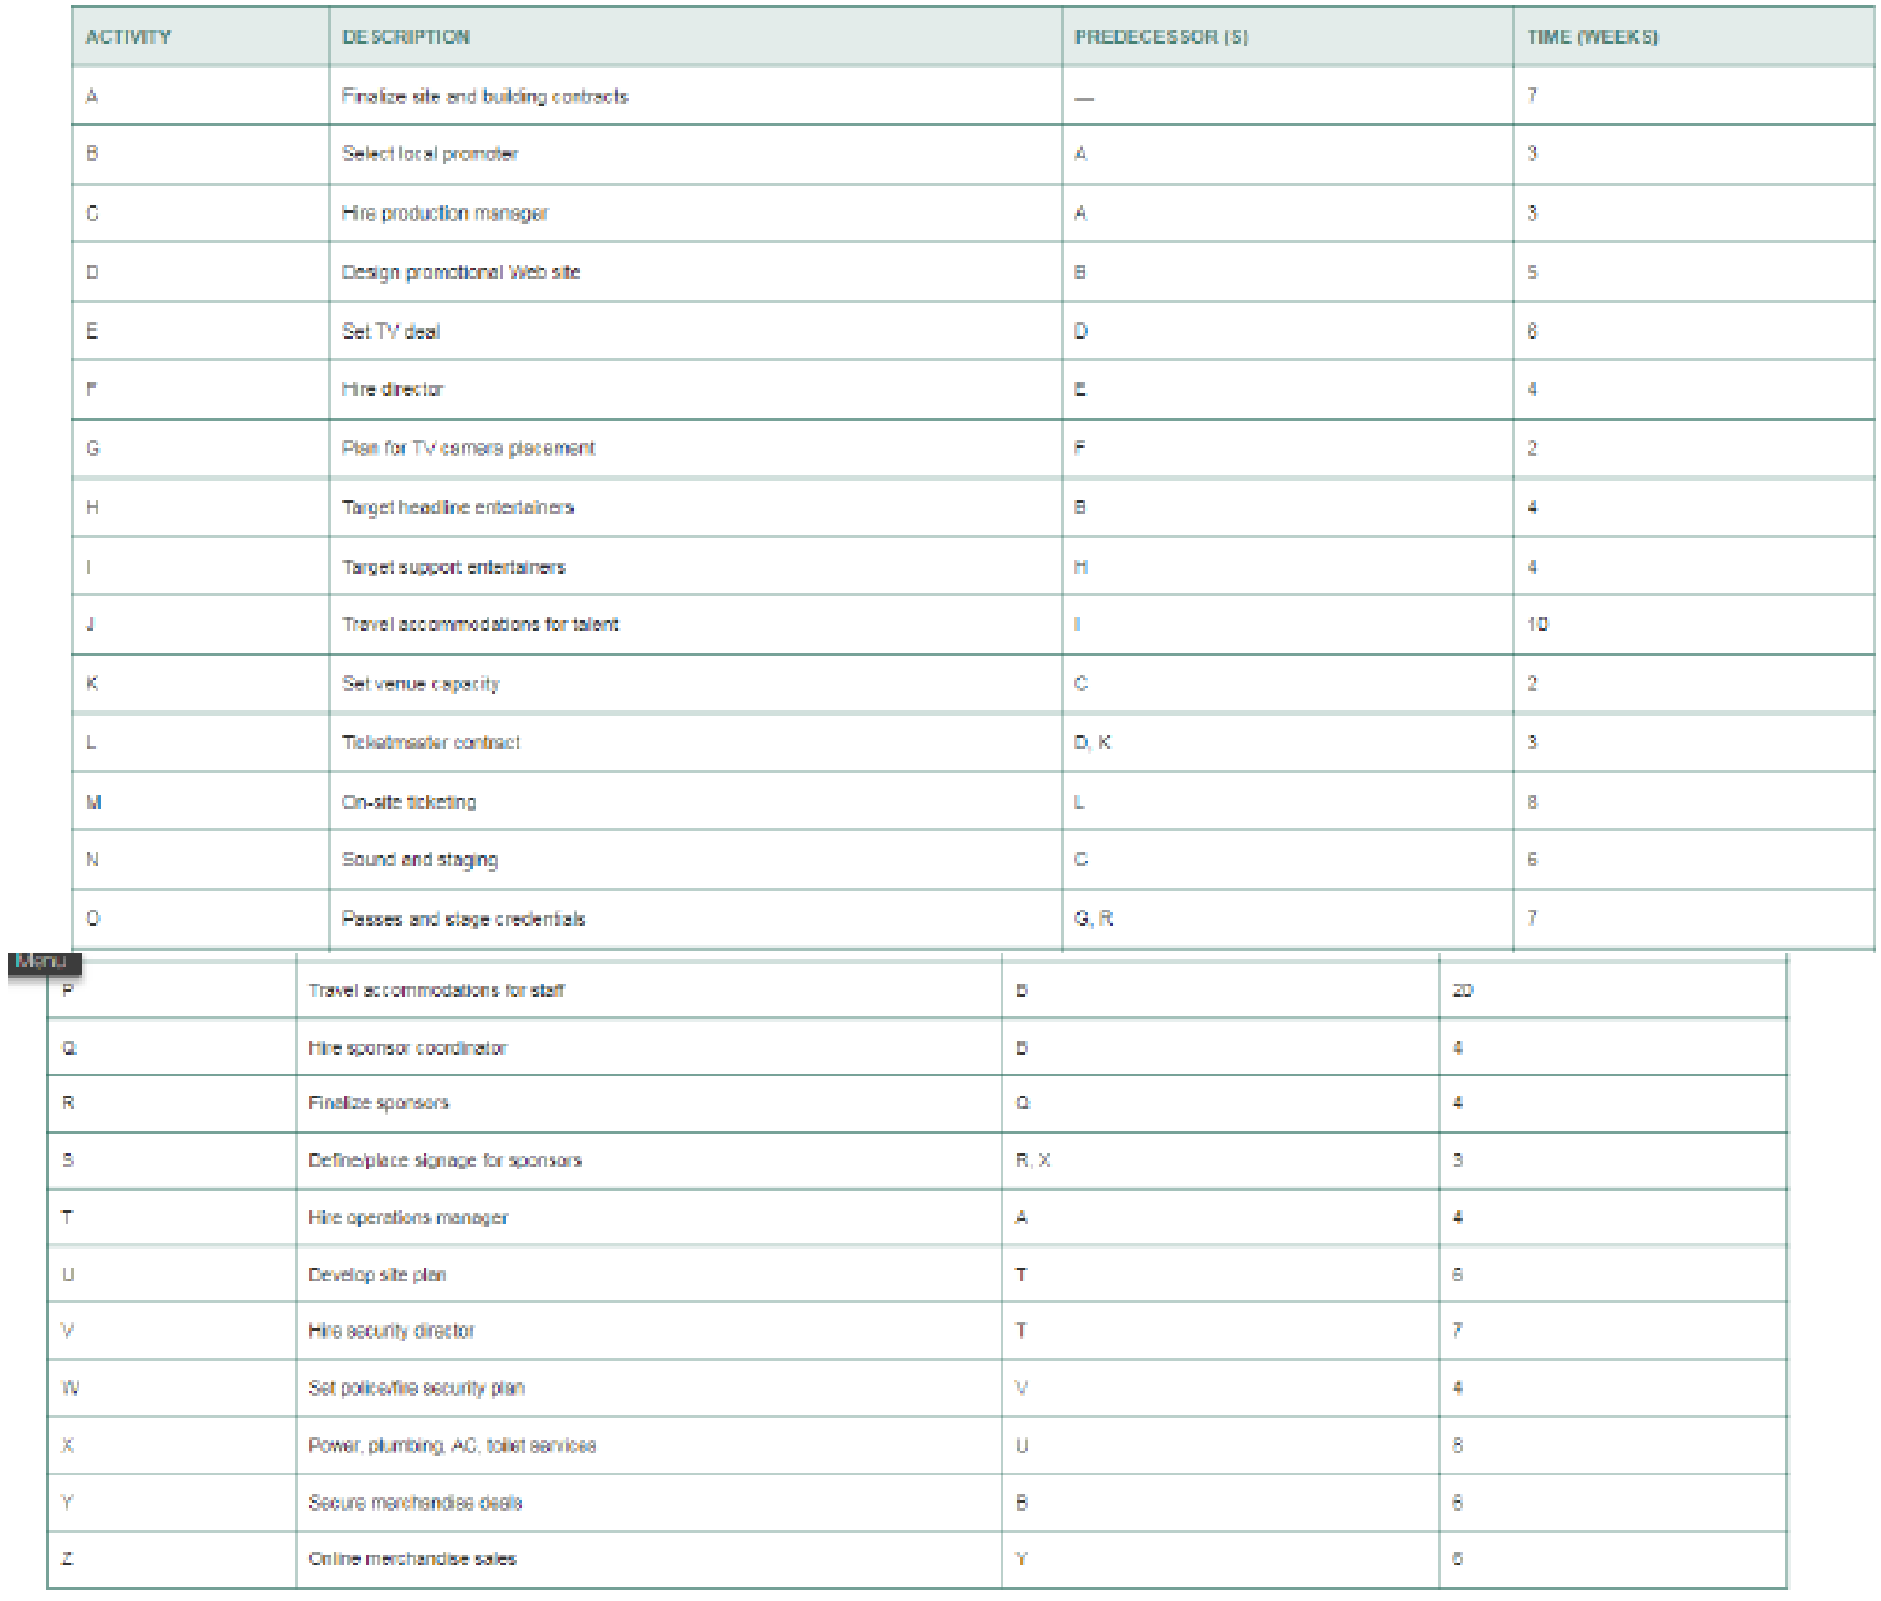
Early in the project management process, Tomasso identifies 10 major tasks (called level-2 activities in a work breakdown structure, or WBS):† talent booking, ticketing, marketing/PR, online promotion, television, show production, travel, sponsorships, operations, and merchandising Using a WBS, each of these is further divided into a series of subtasks. Table 3.8 identifies 26 of the major activities and subactivities, their immediate predecessors, and time estimates. Tomasso enters all these into the Microsoft Project software.‡ Tomasso alters the Microsoft Project document and the time line as the project progresses. “It’s okay to change it as long as you keep on track,” he states.
† The level-1 activity is the Rockfest concert itself.
‡ There are actually 127 activities used by Tomasso: the list is abbreviated for this case study.
TABLE 3.8 Some of the Major Activities and Subactivities in the Rockfest Plan

The day of the rock concert itself is not the end of the project planning. “It’s nothing but surprises. A band not being able to get to the venue because of traffic jams is a surprise, but an ‘anticipated’ surprise. We had a helicopter on stand-by ready to fly the band in,” says Tomasso.
On completion of Rocktest in July, Tomasso and his team have a 3-month reprieve before starting the project planning process again.
3. Identify five major challenges a project manager faces in events such as this one.
Want to see the full answer?
Check out a sample textbook solution
Chapter 3 Solutions
Operations Management: Sustainability and Supply Chain Management (12th Edition)
- Project Managementarrow_forwardProject # SR 55H has finished 13 months of a 24 month planned schedule. You are given the metrics below: What is the project status? Budget for the program = $55,000; EV (cumulative) = $27,500; AC (cumulative) = $25,225 a. There appear to be no problems, the project could finish slightly under plan. b. The project is behind schedule, but will finish on time if they are about 12.5% more efficient. c. The Project now is ahead of plan, but might have a problem in finishing on time. d. The Project is in trouble and the team needs to be about 9% more efficient to finish on original plan. e. You cannot tell based on the metrics above. f. You have no idea what to say; they asked the wrong person.arrow_forwardUse the following project status information to calculate each of the requested EVM numbers below (a-i).The project status is reported at the end of week 13. Task Budget Cost Budget Duration Status as of Week 13 A $5,000 2 Weeks 100 percent complete $5,000B $8,500 3 Weeks 100 percent complete $9,000C $15,000 4 Weeks 75 percent complete $14,000D $10,000 4 Weeks 50 percent complete $9,000 E $12,000 4 Weeks Not startedF $15,000 5 Weeks Not started a. Planned Valuedb. Actual costc. Cost varianced. Schedule variancee. Cost performance indexf. Schedule performance indexg. Budget at completionh. Estimation to completei. Estimation at completionarrow_forward
- Earned Value Analysis of the project supported by cost Performance Index and Schedule Performance Index readings. Comment on the progress of each activity and overall health of the project. Activity BCWS ACWP 1- Percentage Completion 80% Rs. 30,000 Rs. 25,000 2- Percentage Completion 40% Rs. 60,000 Rs. 80,000 3- Percentage Completion 100% Rs. 80,000 Rs. 78,000 Cumulative Rs. 170,000 Rs. 183,000arrow_forwardWhy is EVM not used more? Explain how it can manage budgets and evaluate project performance. How do you evaluate cost variation, schedule variance, cost performance index, and schedule performance index figures?arrow_forwardJustify the use of earned value management (EVM) to control expenses and monitor the effectiveness of a project, and speculate as to why it is not used more often. How can one determine if a cost variation, a schedule variance, a cost performance index, or a schedule performance index is favorable or unfavorable? What are some general criteria to follow?arrow_forward
- Please don't provide handwritten solution .....arrow_forwardThe ability to differentiate between project work and project operations is a fundamental concept in the study of project management.Discuss the differences between Project Work and Normal Operations.arrow_forwardExplain how earned value management (EVM) may control costs and monitor project success and hypothesise why it is not utilised more commonly. What are some guidelines for evaluating cost variation, schedule variance, cost performance index, and schedule performance index numbers?arrow_forward
- A successful project need a project management plan. How to ensure this statement. You may have point from the financial management control. Justify its strengths and its weaknessesarrow_forwardProject Duration= Planning on spending per month Project Budget (BAC) Percent complete per month Performance Analysis % Complete Planned Value (PV) Actual Cost (AC) Earned Value (EV) Schedule Variance (SV) Schedule Performance Index (SPI) Cost Variance (CV) Cost Performance Index (CPI) Estimate at Completion (EAC) Estimate to Complete (ETC) Variance at Completion (VAC) 5 months $300,000.00 $1,500,000.00 Month 1 20% 20% of work completed 15% of work completed Spent additional $110,000 Month 2 Instructions: Utilizing the EVM cheat sheet provided by the instructor, complete the calculations i formulas and functions to attain your answers. Please do not simply plug in numbers. This exerci ability to use Excel. Finally, answer the questions below to explain your answers. Question 1: What do your SV numbers tell you about the project schedule and how? Answer 1: Question 2: What do your SPI numbers tell you about the project schedule and how? Answer 2:arrow_forwardYou are the project manager of the softwaration project in the table below. You would like to find the minimum-cost schedule for your project. There is a $500-per-week penalty for each week the prop delayed beyond week 25. In addition, your project team determined that indirect project costs are $2,000 per week. 9 Normal Activity Immediate Predecessor(s) Time (weeks) 1 A B C D E F G H 1 a. What would be your target completion week? The target completion week is week A A, B B D E. F G C.F (Enter your response as an integer.) b. How much would you save in total project costs with your schedule? Total Savings S (Enter your response as an integer) 79832N 10 12 8 Normal Cost (S) 3,000 3,000 10,000 3,000 4,000 2,000 3,000 5,000 2,000 Crash Time (weeks) 1 58829136 Crash Cost ($) 3,000 6,000 12,000 9,000 5,000 5,000 9,000 7,000 8,000arrow_forward
 Practical Management ScienceOperations ManagementISBN:9781337406659Author:WINSTON, Wayne L.Publisher:Cengage,
 Operations ManagementOperations ManagementISBN:9781259667473Author:William J StevensonPublisher:McGraw-Hill Education
 Operations and Supply Chain Management (Mcgraw-hi...Operations ManagementISBN:9781259666100Author:F. Robert Jacobs, Richard B ChasePublisher:McGraw-Hill Education
 Purchasing and Supply Chain ManagementOperations ManagementISBN:9781285869681Author:Robert M. Monczka, Robert B. Handfield, Larry C. Giunipero, James L. PattersonPublisher:Cengage Learning
 Production and Operations Analysis, Seventh Editi...Operations ManagementISBN:9781478623069Author:Steven Nahmias, Tava Lennon OlsenPublisher:Waveland Press, Inc.


