
Concept explainers
Videos
Ross Hopkins, president of Hopkins Hospitality, has developed the tasks, durations, and predecessor relationships in the following table for building new motels. Draw the AON network and answer the questions that follow.
a) What is the expected (estimated) time for activity C?
b) What is the variance for activity C?
c) Based on the calculation of estimated times, what is the critical path?
d) What is the estimated time of the critical path?
e) What is the activity variance along the critical path?
f) What is the probability of completion of the project before week 36?
a)
To determine: The expected time for activity C.
Introduction: In the activity on nodes (AON) project network diagram, the nodes denote activities and the arrows show only the precedence and succession sequence.
Answer to Problem 17P
The expected time for activity C is 12 weeks.
Explanation of Solution
Given information:
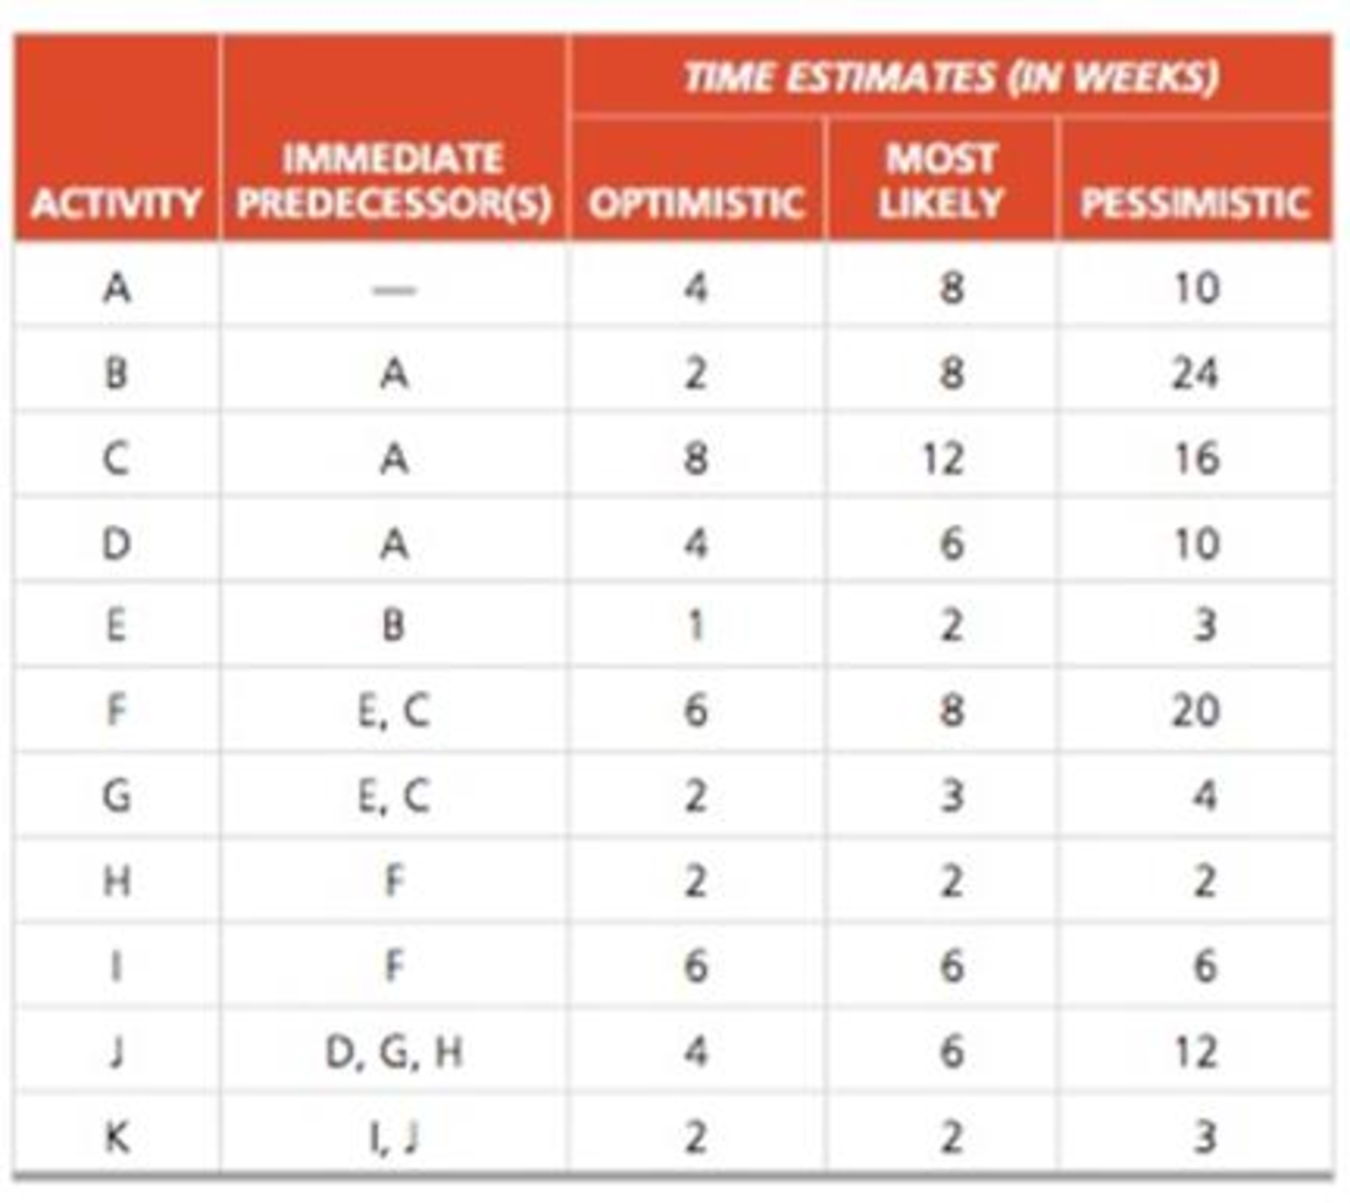
| Activity | Immediate predecessor | Time estimates | ||
| Optimistic | Most likely | Pessimistic | ||
| A | 4 | 8 | 10 | |
| B | A | 2 | 8 | 24 |
| C | A | 8 | 12 | 16 |
| D | A | 4 | 6 | 10 |
| E | B | 1 | 2 | 3 |
| F | E,C | 6 | 8 | 20 |
| G | E,C | 2 | 3 | 4 |
| H | F | 2 | 2 | 2 |
| I | F | 6 | 6 | 6 |
| J | D,G,H | 4 | 6 | 12 |
| K | I,J | 2 | 2 | 3 |
Calculation of expected time for activity C:
AON project network diagram shown below, given the precedence relationships of various activities,
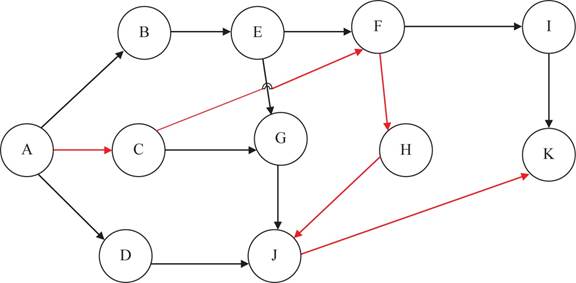
Figure 1
With the given predecessor AON diagram is constructed. To Calculate the expected time for activity C given the data that the optimistic time estimate “a” of activity C of 8 weeks, the most likely time estimate “m” of 12 weeks and the pessimistic time estimate “b” of 16 weeks using the formula.
Where ‘a’ is the optimistic time estimate, ‘m’ is the most likely time estimate and ‘b’ is the pessimistic time estimate
Substitute into the equation (1), the values of
Therefore the expected time for activity C is calcualted by adding 8, 48 and16 and dividing the sum with 6 which gives
Hence, the expected time for activity C is 12 weeks.
b)
To calculate: The variance for activity C.
Answer to Problem 17P
The variance for activity C is 1.78 weeks.
Explanation of Solution
Given information:
| Activity | Immediate predecessor | Time estimates | ||
| Optimistic | Most likely | Pessimistic | ||
| A | 4 | 8 | 10 | |
| B | A | 2 | 8 | 24 |
| C | A | 8 | 12 | 16 |
| D | A | 4 | 6 | 10 |
| E | B | 1 | 2 | 3 |
| F | E,C | 6 | 8 | 20 |
| G | E,C | 2 | 3 | 4 |
| H | F | 2 | 2 | 2 |
| I | F | 6 | 6 | 6 |
| J | D,G,H | 4 | 6 | 12 |
| K | I,J | 2 | 2 | 3 |
Calculation of variance for activity C:
Calculate the variance for activity C using the formula
Substitute in equation (2) the values of
The variance of activity C is calculated by squaring the value obtained by dividing the difference of 16 and 8 with 6 which gives the resultant as 1.28 weeks.
The variance in activity C is 1.78 weeks.
c)
To determine: The critical path.
Answer to Problem 17P
The critical path AàCàFàHàJàK.
Explanation of Solution
Given information:
| Activity | Immediate predecessor | Time estimates | ||
| Optimistic | Most likely | Pessimistic | ||
| A | 4 | 8 | 10 | |
| B | A | 2 | 8 | 24 |
| C | A | 8 | 12 | 16 |
| D | A | 4 | 6 | 10 |
| E | B | 1 | 2 | 3 |
| F | E,C | 6 | 8 | 20 |
| G | E,C | 2 | 3 | 4 |
| H | F | 2 | 2 | 2 |
| I | F | 6 | 6 | 6 |
| J | D,G,H | 4 | 6 | 12 |
| K | I,J | 2 | 2 | 3 |
Calculation of critical path:
Using equation (1) and (2)calculate the expected times and variances for all the activitiesand obtain the values shown in table.
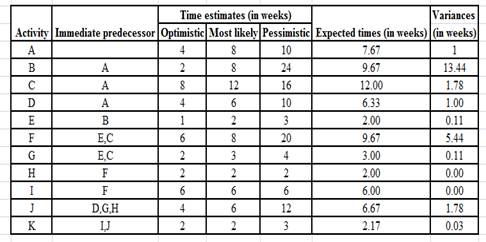
Figure 1, shows the AON diagram which gives the critical path. The critical path is AàCàFàHàJàK.
Hence, the critical path AàCàFàHàJàK.
d)
To Compute: The estimated time of the critical path.
Answer to Problem 17P
The critical path AàCàFàHàJàK which is 40.18 weeks.
Explanation of Solution
Given information:
| Activity | Immediate predecessor | Time estimates | ||
| Optimistic | Most likely | Pessimistic | ||
| A | 4 | 8 | 10 | |
| B | A | 2 | 8 | 24 |
| C | A | 8 | 12 | 16 |
| D | A | 4 | 6 | 10 |
| E | B | 1 | 2 | 3 |
| F | E,C | 6 | 8 | 20 |
| G | E,C | 2 | 3 | 4 |
| H | F | 2 | 2 | 2 |
| I | F | 6 | 6 | 6 |
| J | D,G,H | 4 | 6 | 12 |
| K | I,J | 2 | 2 | 3 |
Calculation of estimated time of the critical path:
Figure 1, shows the AON diagram which gives the critical path. The critical path is AàCàFàHàJàK.
The various paths and the expected completion times are listed in the table
| Various paths | Completion times |
| AàBàEàFàIàK | 37.18 weeks |
| AàBàEàGàJàK | 31.18 weeks |
| AàCàFàHàJàK | 40.18 weeks |
| AàCàGàJàK | 31.51 weeks |
| AàDàJàK | 22.84 weeks |
Hence, the estimated time of the critical path AàCàFàHàJàK is 40.18 weeks.
e)
To determine: The variance of the critical path.
Answer to Problem 17P
The variance of the critical path is 10.03 weeks.
Explanation of Solution
Given information:
| Activity | Immediate predecessor | Time estimates | ||
| Optimistic | Most likely | Pessimistic | ||
| A | 4 | 8 | 10 | |
| B | A | 2 | 8 | 24 |
| C | A | 8 | 12 | 16 |
| D | A | 4 | 6 | 10 |
| E | B | 1 | 2 | 3 |
| F | E,C | 6 | 8 | 20 |
| G | E,C | 2 | 3 | 4 |
| H | F | 2 | 2 | 2 |
| I | F | 6 | 6 | 6 |
| J | D,G,H | 4 | 6 | 12 |
| K | I,J | 2 | 2 | 3 |
Calculation of variance of the critical path:
The activity variance σ2along the critical path AàCàFàHàJàK is the sum of the variances of individual activities A, C, F, H, J and K.
Therefore,
The activity variance along the critical path is the sum of 1, 1.78, 5.44, 0, 1.78, 0.03 is 10.03 weeks.
Hence, the variance of the critical path is 10.03 weeks
f)
To compute: The probability of completion of the project before week 36 weeks.
Answer to Problem 17P
The probability of completion of the project before week 36 weeks is 9.34%.
Explanation of Solution
Given information:
| Activity | Immediate predecessor | Time estimates | ||
| Optimistic | Most likely | Pessimistic | ||
| A | 4 | 8 | 10 | |
| B | A | 2 | 8 | 24 |
| C | A | 8 | 12 | 16 |
| D | A | 4 | 6 | 10 |
| E | B | 1 | 2 | 3 |
| F | E,C | 6 | 8 | 20 |
| G | E,C | 2 | 3 | 4 |
| H | F | 2 | 2 | 2 |
| I | F | 6 | 6 | 6 |
| J | D,G,H | 4 | 6 | 12 |
| K | I,J | 2 | 2 | 3 |
Calculation of probability of completion of the project before week 36 weeks:
Use the normal distribution tables given that the estimated mean time is 40.18 weeks and the standard deviation is square root of 10.03 weeks.
First compute the standard deviation σ by computing the square root of 10.03 weeks.
Calculate the z value as shown below
For a z value of -1.32, the probability is 9.34%.
Therefore, there is a probability of 9.34% that the project may be completed on or before 36 weeks.
Hence, the probability of completion of the project before week 36 weeks is 9.34%.
Want to see more full solutions like this?
Chapter 3 Solutions
EBK PRINCIPLES OF OPERATIONS MANAGEMENT


- Doctor Earrow_forwardConsidering contemporary challenges in business, analyze a real-world case where a company successfully navigated a major shift in its marketing strategy to adapt to changing market dynamics. Discussion Question and Prompt: Identify the key factors that contributed to the success of their marketing strategy in the face of contemporary issues. How can businesses draw insights from this case to inform their own marketing strategies amid current business challenges?arrow_forward1) View the video Service Processing at BuyCostumes (10.41 minutes, Ctrl+Click on the link); what are your key takeaways (tie to one or more of the topics discussed in Chapter 3) after watching this video. (viddler.com/embed/a6b7054c) Note: As a rough guideline, please try to keep the written submission to one or two paragraphs. 2) Orkhon Foods makes hand-held pies (among other products). The firm’s weekly sales of hand-held pies over the past seven weeks are given in the table. The firm’s operations manager, Amarjargal, wants to forecast sales for week 8. Weeks Sales of hand-held pies(000s) 1 19 2 18 3 17 4 20 5 18 6 22 7 20 Forecast the week 8 sales using the following approaches: a) Naïve approach b) 5-month moving average c) 3-month weighted moving average using the following weights: 0.50 for week 7, 0.30 for week 6, and 0.20 for week 5. d) Exponential smoothing using a smoothing constant of 0.30, assume a…arrow_forward
- Answer all parts to question 4 and show all workingarrow_forward1) View the video Service Processing at BuyCostumes (10.41 minutes, Ctrl+Click on the link); what are your key takeaways (tie to one or more of the topics discussed in Chapter 3) after watching this video. (viddler.com/embed/a6b7054c) Note: As a rough guideline, please try to keep the written submission to one or two paragraphs. 2) Orkhon Foods makes hand-held pies (among other products). The firm’s weekly sales of hand-held pies over the past seven weeks are given in the table. The firm’s operations manager, Amarjargal, wants to forecast sales for week 8. Weeks Sales of hand-held pies(000s) 1 19 2 18 3 17 4 20 5 18 6 22 7 20 Forecast the week 8 sales using the following approaches: a) Naïve approach b) 5-month moving average c) 3-month weighted moving average using the following weights: 0.50 for week 7, 0.30 for week 6, and 0.20 for week 5. d) Exponential smoothing using a smoothing constant of 0.30, assume a week 2…arrow_forwardWhat area of emotional intelligence refers to the ability to manage your emotions, particularly in stressful situations, and maintain a positive outlook despite setbacks? relationship management self awareness social awareness self managementarrow_forward
- What area of emotional intelligence refers to the ability to manage your emotions, particularly in stressful situations, and maintain a positive outlook despite setbacks? relationship management self awareness social awareness self managementarrow_forwardThis area of emotional intelligence describes your ability to not only understand your strengths and weaknesses but to recognize your emotions and their effect on you and your team’s performance self management self awareness relationship management social awarenessarrow_forwardEmotional intelligence is defined as the ability to understand and manage your emotions, as well as recognize and influence the emotions of those around you. True Falsearrow_forward
- At the Ford automobile Highland plant, assume the one-millionth vehicle was produced in 1916 at a cost of $8084 (in 2013 US$), by how much did the Ford company reduce his cost with each doubling of cumulative output from 1916 to 1927?arrow_forwardAt the Ford automobile Highland plant,in 1913, how long did the average worker stay with the plant and what was the average tenure of a worker?arrow_forwardCommunity Federal Bank in Dothan, Alabama, recently increased its fees to customers who use employees as tellers. Management is interested in whether its new tee policy has increased the number of customers now using its automatic teller machines to that point that more machines are required. The following table provides the number of automatic teller transactions by week. Use trend projection with regression to forecast usage for weeks 13-16.arrow_forward
 Practical Management ScienceOperations ManagementISBN:9781337406659Author:WINSTON, Wayne L.Publisher:Cengage,
 Purchasing and Supply Chain ManagementOperations ManagementISBN:9781285869681Author:Robert M. Monczka, Robert B. Handfield, Larry C. Giunipero, James L. PattersonPublisher:Cengage Learning