Concept explainers
Videos
Use Figure 3.4 to specify the region of the
Hint: Change each wavelength to meters before making the comparison.
- a. 2.0 cm
- b. 50 um
- c. 400 nm
- d. 150 mm
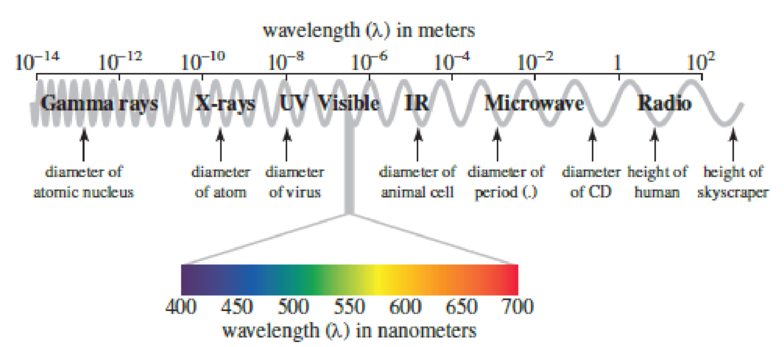
Figure 3.4
The electromagnetic spectrum, highlighting the visible region. Note that 10x is equivalent to 1 × 10x.
(a)
Interpretation:
The region of the electromagnetic spectrum for the given wavelength has to be specified.
Concept-Introduction:
Wavelength: The distance between successive peaks in a wave and measured in units of length.
Frequency: The number of waves passed a point in a certain amount of time.
Relation between wavelength and frequency:
Where, c is constant, the value of c is
Conversion of centimeter into meter (cm to m):
Explanation of Solution
The wavelength is
Conversion of centimeter to meter is,
Therefore, the given value of wavelength in meter is
(b)
Interpretation:
The region of the electromagnetic spectrum for the given wavelength has to be specified.
Concept-Introduction:
Wavelength: The distance between successive peaks in a wave and measured in units of length.
Frequency: The number of waves passed a point in a certain amount of time.
Relation between wavelength and frequency:
Where, c is constant, the value of c is
Conversion of micrometer into meter (
Explanation of Solution
The wavelength is
Conversion of micrometer to meter is,
Therefore, the given value of wavelength in meter is
(c)
Interpretation:
The region of the electromagnetic spectrum for the given wavelength has to be specified.
Concept-Introduction:
Wavelength: The distance between successive peaks in a wave and measured in units of length.
Frequency: The number of waves passed a point in a certain amount of time.
Relation between wavelength and frequency:
Where, c is constant, the value of c is
Conversion of nanometer into meter (nm to m):
Explanation of Solution
The given wavelength is
Conversion of nanometer to meter is,
Therefore, the given value of wavelength in meter is
(d)
Interpretation:
The region of the electromagnetic spectrum for the given wavelength has to be specified.
Concept-Introduction:
Wavelength: The distance between successive peaks in a wave and measured in units of length.
Frequency: The number of waves passed a point in a certain amount of time.
Relation between wavelength and frequency:
Where, c is constant, the value of c is
Conversion of millimeter into nanometer (mm to m):
Explanation of Solution
The given wavelength is
Conversion of millimeter to meter is,
Therefore, the given value of wavelength in meter is
Want to see more full solutions like this?
Chapter 3 Solutions
Chemistry In Context
Additional Science Textbook Solutions
Microbiology: Principles and Explorations
Campbell Essential Biology (7th Edition)
Loose Leaf For Integrated Principles Of Zoology
Biology: Life on Earth with Physiology (11th Edition)
Organic Chemistry
Physical Universe


- If I have 10 data points for variables x and y, when I represent y versus x I obtain a line with the equation y = mx + b. Is the slope m equal to dy/dx?arrow_forwardThe data for the potential difference of a battery and its temperature are given in the table. Calculate the entropy change in J mol-1 K-1 (indicate the formulas used).Data: F = 96485 C mol-1arrow_forwardIn a cell, the change in entropy (AS) can be calculated from the slope of the E° vs 1/T graph. The slope is equal to -AS/R, where R is the gas constant. Is this correct?arrow_forward
- Using the Arrhenius equation, it is possible to establish the relationship between the rate constant (k) of a chemical reaction and the temperature (T), in Kelvin (K), the universal gas constant (R), the pre-exponential factor (A) and the activation energy (Ea). This equation is widely applied in studies of chemical kinetics, and is also widely used to determine the activation energy of reactions. In this context, the following graph shows the variation of the rate constant with the inverse of the absolute temperature, for a given chemical reaction that obeys the Arrhenius equation. Based on the analysis of this graph and the concepts acquired about the kinetics of chemical reactions, analyze the following statements: I. The activation energy (Ea) varies with the temperature of the system. II. The activation energy (Ea) varies with the concentration of the reactants. III. The rate constant (K) varies proportionally with temperature. IV. The value of the…arrow_forwardIn an electrolytic cell, indicate the formula that relates E0 to the temperature T.arrow_forward-- 14:33 A Candidate Identification docs.google.com 11. Compound A can transform into compound B through an organic reaction. From the structures below, mark the correct one: HO A تھے۔ די HO B ○ A) Compounds A and B are isomers. B) Both have the same number of chiral carbons. C) Compound A underwent an addition reaction of Cl2 and H2O to form compound B. D) Compound A underwent a substitution reaction forming the intermediate chlorohydrin to obtain compound B. E) Compound A underwent an addition reaction of Cl2 forming the chloronium ion and then added methanol to obtain compound B. 60arrow_forward
- -- 14:40 A Candidate Identification docs.google.com 13. The compound 1-bromo-hex-2-ene reacts with methanol to form two products. About this reaction, mark the correct statement: OCH3 CH3OH Br OCH3 + + HBr A B A) The two products formed will have the same percentage of formation. B) Product B will be formed by SN1 substitution reaction with the formation of an allylic carbocation. C) Product A will be formed by SN1 substitution reaction with the formation of a more stable carbocation than product B. D) Product A will be formed by an SN2 substitution reaction occurring in two stages, the first with slow kinetics and the second with fast kinetics. E) The two compounds were obtained by addition reaction, with compound B having the highest percentage of formation. 57arrow_forward-- ☑ 14:30 A Candidate Identification docs.google.com 10. Amoxicillin (figure X) is one of the most widely used antibiotics in the penicillin family. The discovery and synthesis of these antibiotics in the 20th century made the treatment of infections that were previously fatal routine. About amoxicillin, mark the correct one: HO NH2 H S -N. HO Figura X. Amoxicilina A) It has the organic functions amide, ester, phenol and amine. B) It has four chiral carbons and 8 stereoisomers. C) The substitution of the aromatic ring is of the ortho-meta type. D) If amoxicillin reacts with an alcohol it can form an ester. E) The structure has two tertiary amides. 62arrow_forwardThe environmental police of a Brazilian state received a report of contamination of a river by inorganic arsenic, due to the excessive use of pesticides on a plantation on the riverbanks. Arsenic (As) is extremely toxic in its many forms and oxidation states. In nature, especially in groundwater, it is found in the form of arsenate (AsO ₄ ³ ⁻ ), which can be electrochemically reduced to As ⁰ and collected at the cathode of a coulometric cell. In this case, Potentiostatic Coulometry (at 25°C) was performed in an alkaline medium (pH = 7.5 throughout the analysis) to quantify the species. What potential (E) should have been selected/applied to perform the analysis, considering that this is an exhaustive electrolysis technique (until 99.99% of all AsO ₄ ³ ⁻ has been reduced to As ⁰ at the electrode, or n( final) = 0.01% n( initial )) and that the concentration of AsO ₄ ³ ⁻ found in the initial sample was 0.15 mmol/L ? Data: AsO ₄ 3 ⁻ (aq) + 2 H ₂ O ( l ) + 2 e ⁻ → A s O ₂ ⁻ ( a…arrow_forward
- -- 14:17 15. Water-soluble proteins are denatured when there is a change in the pH of the environment in which they are found. This occurs due to the protonation and deprotonation of functional groups present in their structure. Choose the option that indicates the chemical bonds modified by pH in the protein represented in the following figure. E CH2 C-OH CH2 H₂C H₁C CH CH3 CH3 CH CH₂-S-S-CH₂- 910 H B -CH2-CH2-CH2-CH₂-NH3* −0—C—CH₂- ○ A) A, C e D. • В) Вес ○ C) DeE ○ D) B, De E ○ E) A, B e C 68arrow_forwardSuppose sodium sulfate has been gradually added to 100 mL of a solution containing calcium ions and strontium ions, both at 0.15 mol/L. Indicate the alternative that presents the percentage of strontium ions that will have precipitated when the calcium sulfate begins to precipitate. Data: Kps of calcium sulfate: 2.4x10 ⁻ ⁵; Kps of strontium sulfate: 3.2x10 ⁻ ⁷ A) 20,2 % B) 36,6 % C) 62,9 % D) 87,5 % E) 98.7%arrow_forward14:43 A Candidate Identification docs.google.com 14. The following diagrams represent hypothetical membrane structures with their components numbered from 1 to 6. Based on the figures and your knowledge of biological membranes, select the correct alternative. | 3 5 || 人 2 500000 6 A) Structures 1, 3, 5, 2 and 4 are present in a constantly fluid arrangement that allows the selectivity of the movement ○ of molecules. Structure 4, present integrally or peripherally, is responsible for this selection, while the quantity of 6 regulates the fluidity. B) The membranes isolate the cell from the environment, but allow the passage of water-soluble molecules thanks to the presence of 2 and 3. The membrane in scheme is more fluid than that in 55arrow_forward
 Chemistry & Chemical ReactivityChemistryISBN:9781133949640Author:John C. Kotz, Paul M. Treichel, John Townsend, David TreichelPublisher:Cengage Learning
 Chemistry & Chemical ReactivityChemistryISBN:9781337399074Author:John C. Kotz, Paul M. Treichel, John Townsend, David TreichelPublisher:Cengage Learning
 Chemistry: Matter and ChangeChemistryISBN:9780078746376Author:Dinah Zike, Laurel Dingrando, Nicholas Hainen, Cheryl WistromPublisher:Glencoe/McGraw-Hill School Pub Co
 Chemistry: The Molecular ScienceChemistryISBN:9781285199047Author:John W. Moore, Conrad L. StanitskiPublisher:Cengage Learning
 Chemistry by OpenStax (2015-05-04)ChemistryISBN:9781938168390Author:Klaus Theopold, Richard H Langley, Paul Flowers, William R. Robinson, Mark BlaserPublisher:OpenStax