
(a)
Interpretation:
The greatest and least retention of components in mobile phase has to be explained.
(a)
Explanation of Solution
To explain: The greatest and least retention of components in mobile phase
- Increase in volume of organic solvent increases the mobile phase strength in reversed phase column chromatography.
-
- At
(b)
Interpretation:
The mobile phase of each composition separation has to be drawn as chromatogram.
Concept introduction:
The above equation shows that the value of resolution is proportional to
(b)
Explanation of Solution
To draw: The mobile phase of each composition separation.
Conversion of log k to retention time.
The chromatogram is given below as
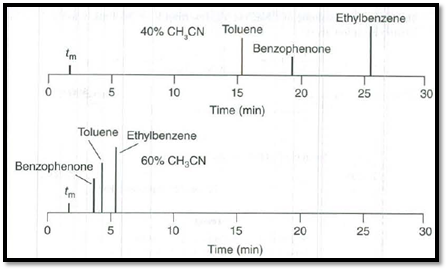
Figure 1
(c)
Interpretation:
The
Concept introduction:
The above equation shows that the value of resolution is proportional to
(c)
Explanation of Solution
To draw: The
The compounds with closest peak have very less resolution and those are benzophenone and toluene. The retention factors of these compounds are given as
Relative retention is calculated as
(d)
Interpretation:
The
Concept introduction:
The above equation shows that the value of resolution is proportional to
(d)
Explanation of Solution
To draw: The
For good separation of peaks the criteria are
The
Want to see more full solutions like this?
Chapter 25 Solutions
Quantitative Chemical Analysis 9e And Sapling Advanced Single Course For Analytical Chemistry (access Card)

- Provide the semi-developed formula of isooxazole obtained by reacting acetylacetone and hydroxylamine.arrow_forwardGiven a 1,3-dicarbonyl compound (R1-CO-CH2-CO-R2), indicate the formula of the compound obtaineda) if I add hydroxylamine (NH2OH) to give an isooxazole.b) if I add thiosemicarbazide (NH2-CO-NH-NH2) to give an isothiazole.arrow_forwardAn orange laser has a wavelength of 610 nm. What is the energy of this light?arrow_forward
- The molar absorptivity of a protein in water at 280 nm can be estimated within ~5-10% from its content of the amino acids tyrosine and tryptophan and from the number of disulfide linkages (R-S-S-R) between cysteine residues: Ε280 nm (M-1 cm-1) ≈ 5500 nTrp + 1490 nTyr + 125 nS-S where nTrp is the number of tryptophans, nTyr is the number of tyrosines, and nS-S is the number of disulfide linkages. The protein human serum transferrin has 678 amino acids including 8 tryptophans, 26 tyrosines, and 19 disulfide linkages. The molecular mass of the most dominant for is 79550. Predict the molar absorptivity of transferrin. Predict the absorbance of a solution that’s 1.000 g/L transferrin in a 1.000-cm-pathlength cuvet. Estimate the g/L of a transferrin solution with an absorbance of 1.50 at 280 nm.arrow_forwardIn GC, what order will the following molecules elute from the column? CH3OCH3, CH3CH2OH, C3H8, C4H10arrow_forwardBeer’s Law is A = εbc, where A is absorbance, ε is the molar absorptivity (which is specific to the compound and wavelength in the measurement), and c is concentration. The absorbance of a 2.31 × 10⁻⁵ M solution of a compound is 0.822 at a wavelength of 266 nm in a 1.00-cm cell. Calculate the molar absorptivity at 266 nm.arrow_forward
- How to calculate % of unknown solution using line of best fit y=0.1227x + 0.0292 (y=2.244)arrow_forwardGiven a 1,3-dicarbonyl compound, state the (condensed) formula of the compound obtaineda) if I add hydroxylamine (NH2OH) to give an isooxazole.b) if I add thiosemicarbazide (NH2-CO-NH-NH2) to give an isothiazole.arrow_forwardComplete the following acid-base reactions and predict the direction of equilibrium for each. Justify your prediction by citing pK values for the acid and conjugate acid in each equilibrium. (a) (b) NHs (c) O₂N NH NH OH H₁PO₁arrow_forward
- 23.34 Show how to convert each starting material into isobutylamine in good yield. ཅ ནད ཀྱི (b) Br OEt (c) (d) (e) (f) Harrow_forwardPlease help me Please use https://app.molview.com/ to draw this. I tried, but I couldn't figure out how to do it.arrow_forwardPropose a synthesis of 1-butanamine from the following: (a) a chloroalkane of three carbons (b) a chloroalkane of four carbonsarrow_forward
 ChemistryChemistryISBN:9781305957404Author:Steven S. Zumdahl, Susan A. Zumdahl, Donald J. DeCostePublisher:Cengage Learning
 ChemistryChemistryISBN:9781259911156Author:Raymond Chang Dr., Jason Overby ProfessorPublisher:McGraw-Hill Education
 Principles of Instrumental AnalysisChemistryISBN:9781305577213Author:Douglas A. Skoog, F. James Holler, Stanley R. CrouchPublisher:Cengage Learning
 Organic ChemistryChemistryISBN:9780078021558Author:Janice Gorzynski Smith Dr.Publisher:McGraw-Hill Education
 Chemistry: Principles and ReactionsChemistryISBN:9781305079373Author:William L. Masterton, Cecile N. HurleyPublisher:Cengage Learning
 Elementary Principles of Chemical Processes, Bind...ChemistryISBN:9781118431221Author:Richard M. Felder, Ronald W. Rousseau, Lisa G. BullardPublisher:WILEY