Concept explainers
Ogive: Using the data in Exercise 28:
- Compute the cumulative frequencies for the classes in the American League frequency distribution.
- Construct a frequency ogive for the American League frequency distribution.
- Compute the cumulative relative frequencies for the classes in the American League frequency distribution.
- Construct a relative frequency ogive for the American League, using the same classes.
- Compute the cumulative frequencies for the classes in the National League frequency distribution.
- Construct a frequency ogive for the National League frequency distribution.
- Compute the cumulative relative frequencies for the classes in the National League frequency distribution.
- Construct a relative frequency ogive for the National League, using the same classes.
a.
To compute:The cumulative frequencies for the classes in the American League frequency distribution.
Answer to Problem 44E
| Batting average | American League Cumulative Frequency |
| 0.180-0.199 | 2 |
| 0.200-0.219 | 9 |
| 0.220-0.239 | 30 |
| 0.240-0.259 | 60 |
| 0.260-0.279 | 86 |
| 0.280-0.299 | 107 |
| 0.300-0.319 | 119 |
| 0.320-0.339 | 124 |
| 0.340-0.359 | 124 |
Explanation of Solution
Given information:The following frequency distribution presents the batting averages of Major League Baseball players in both the American League and the National League who had 300 or more plate appearances during a recent season.
| Batting average | American LeagueFrequency | National LeagueFrequency |
| 0.180-0.199 | 2 | 2 |
| 0.200-0.219 | 7 | 7 |
| 0.220-0.239 | 21 | 20 |
| 0.240-0.259 | 30 | 29 |
| 0.260-0.279 | 26 | 32 |
| 0.280-0.299 | 21 | 30 |
| 0.300-0.319 | 12 | 17 |
| 0.320-0.339 | 5 | 5 |
| 0.340-0.359 | 0 | 1 |
Definition used: The cumulative frequency of a class is the sum of the frequencies of that class and all previous classes.
Calculation:
The cumulative classes are given by in the following table.
| Batting average | American LeagueFrequency | American League Cumulative Frequency |
| 0.180-0.199 | 2 | 2 |
| 0.200-0.219 | 7 | |
| 0.220-0.239 | 21 | |
| 0.240-0.259 | 30 | |
| 0.260-0.279 | 26 | |
| 0.280-0.299 | 21 | |
| 0.300-0.319 | 12 | |
| 0.320-0.339 | 5 | |
| 0.340-0.359 | 0 |
Hence, the cumulative frequency for American league is given by
| Batting average | American League Cumulative Frequency |
| 0.180-0.199 | 2 |
| 0.200-0.219 | 9 |
| 0.220-0.239 | 30 |
| 0.240-0.259 | 60 |
| 0.260-0.279 | 86 |
| 0.280-0.299 | 107 |
| 0.300-0.319 | 119 |
| 0.320-0.339 | 124 |
| 0.340-0.359 | 124 |
b.
To find:The frequency ogive for the frequency distribution.
Explanation of Solution
Given information:The following frequency distribution presents the batting averages of Major League Baseball players in both the American League and the National League who had 300 or more plate appearances during a recent season.
| Batting average | American LeagueFrequency | National LeagueFrequency |
| 0.180-0.199 | 2 | 2 |
| 0.200-0.219 | 7 | 7 |
| 0.220-0.239 | 21 | 20 |
| 0.240-0.259 | 30 | 29 |
| 0.260-0.279 | 26 | 32 |
| 0.280-0.299 | 21 | 30 |
| 0.300-0.319 | 12 | 17 |
| 0.320-0.339 | 5 | 5 |
| 0.340-0.359 | 0 | 1 |
Definition used:An ogive plots the cumulative frequencies.
Solution:
The table of cumulative American League frequency is given by
| Batting average | American League Cumulative Frequency |
| 0.180-0.199 | 2 |
| 0.200-0.219 | 9 |
| 0.220-0.239 | 30 |
| 0.240-0.259 | 60 |
| 0.260-0.279 | 86 |
| 0.280-0.299 | 107 |
| 0.300-0.319 | 119 |
| 0.320-0.339 | 124 |
| 0.340-0.359 | 124 |
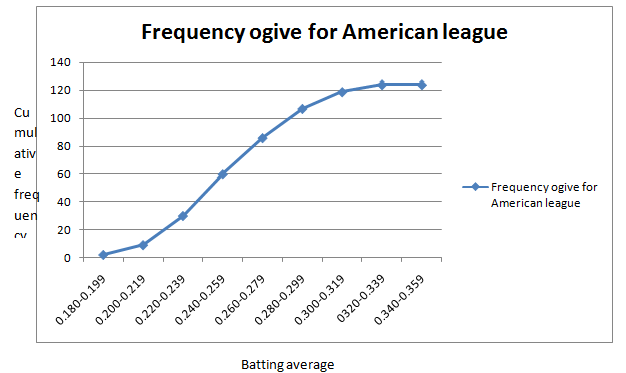
The frequency ogivefor American League frequency distribution is given by

c.
To compute: The cumulative relative frequencies for the classes in the American league frequency distribution.
Answer to Problem 44E
| Batting average | Cumulative relative Frequency |
| 0.180-0.199 | 0.016 |
| 0.200-0.219 | 0.073 |
| 0.220-0.239 | 0.242 |
| 0.240-0.259 | 0.484 |
| 0.260-0.279 | 0.694 |
| 0.280-0.299 | 0.863 |
| 0.300-0.319 | 0.960 |
| 0.320-0.339 | 1.000 |
| 0.340-0.359 | 1.000 |
Explanation of Solution
Given information: The following frequency distribution presents the batting averages of Major League Baseball players in both the American League and the National League who had 300 or more plate appearances during a recent season.
| Batting average | American LeagueFrequency | National LeagueFrequency |
| 0.180-0.199 | 2 | 2 |
| 0.200-0.219 | 7 | 7 |
| 0.220-0.239 | 21 | 20 |
| 0.240-0.259 | 30 | 29 |
| 0.260-0.279 | 26 | 32 |
| 0.280-0.299 | 21 | 30 |
| 0.300-0.319 | 12 | 17 |
| 0.320-0.339 | 5 | 5 |
| 0.340-0.359 | 0 | 1 |
Definition used: The cumulative relative frequency of a class is given by
Calculation:
The cumulative classes are given by in the following table.
| Batting average | American League Cumulative Frequency | American League relative Cumulative Frequency |
| 0.180-0.199 | 2 | |
| 0.200-0.219 | 9 | |
| 0.220-0.239 | 30 | |
| 0.240-0.259 | 60 | |
| 0.260-0.279 | 86 | |
| 0.280-0.299 | 107 | |
| 0.300-0.319 | 119 | |
| 0.320-0.339 | 124 | |
| 0.340-0.359 | 124 |
Hence, the cumulative relative frequency is given by
| Batting average | Cumulative relative Frequency |
| 0.180-0.199 | 0.016 |
| 0.200-0.219 | 0.073 |
| 0.220-0.239 | 0.242 |
| 0.240-0.259 | 0.484 |
| 0.260-0.279 | 0.694 |
| 0.280-0.299 | 0.863 |
| 0.300-0.319 | 0.960 |
| 0.320-0.339 | 1.000 |
| 0.340-0.359 | 1.000 |
d.
To find: The relative frequency ogive for the American league frequency distribution.
Explanation of Solution
Given information:The following frequency distribution presents the batting averages of Major League Baseball players in both the American League and the National League who had 300 or more plate appearances during a recent season.
| Batting average | American LeagueFrequency | National LeagueFrequency |
| 0.180-0.199 | 2 | 2 |
| 0.200-0.219 | 7 | 7 |
| 0.220-0.239 | 21 | 20 |
| 0.240-0.259 | 30 | 29 |
| 0.260-0.279 | 26 | 32 |
| 0.280-0.299 | 21 | 30 |
| 0.300-0.319 | 12 | 17 |
| 0.320-0.339 | 5 | 5 |
| 0.340-0.359 | 0 | 1 |
Definition used:A relative frequency ogive plots the cumulative relative frequencies..
Solution:
The table of cumulative relative frequency is given by
| Batting average | Cumulative relative Frequency |
| 0.180-0.199 | 0.016 |
| 0.200-0.219 | 0.073 |
| 0.220-0.239 | 0.242 |
| 0.240-0.259 | 0.484 |
| 0.260-0.279 | 0.694 |
| 0.280-0.299 | 0.863 |
| 0.300-0.319 | 0.960 |
| 0.320-0.339 | 1.000 |
| 0.340-0.359 | 1.000 |
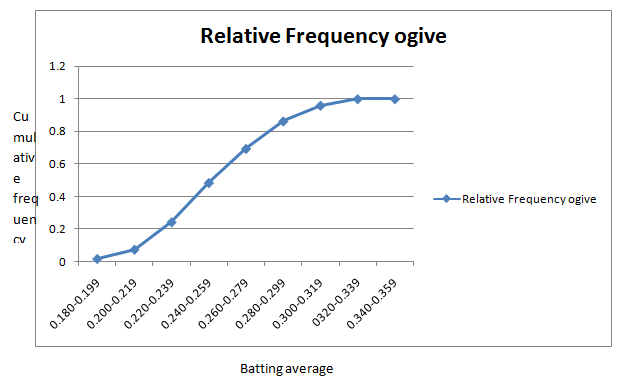
The relative frequency ogive is given by

e.
To compute: The cumulative frequencies for the classes in the National League frequency distribution.
Answer to Problem 44E
| Batting average | National League Cumulative Frequency |
| 0.180-0.199 | 2 |
| 0.200-0.219 | 9 |
| 0.220-0.239 | 29 |
| 0.240-0.259 | 58 |
| 0.260-0.279 | 90 |
| 0.280-0.299 | 120 |
| 0.300-0.319 | 137 |
| 0.320-0.339 | 142 |
| 0.340-0.359 | 143 |
Explanation of Solution
Given information: The following frequency distribution presents the batting averages of Major League Baseball players in both the American League and the National League who had 300 or more plate appearances during a recent season.
| Batting average | American LeagueFrequency | National LeagueFrequency |
| 0.180-0.199 | 2 | 2 |
| 0.200-0.219 | 7 | 7 |
| 0.220-0.239 | 21 | 20 |
| 0.240-0.259 | 30 | 29 |
| 0.260-0.279 | 26 | 32 |
| 0.280-0.299 | 21 | 30 |
| 0.300-0.319 | 12 | 17 |
| 0.320-0.339 | 5 | 5 |
| 0.340-0.359 | 0 | 1 |
Definition used: The cumulative frequency of a class is the sum of the frequencies of that class and all previous classes.
Calculation:
The cumulative classes are given by in the following table.
| Batting average | National LeagueFrequency | National League Cumulative Frequency |
| 0.180-0.199 | 2 | 2 |
| 0.200-0.219 | 7 | |
| 0.220-0.239 | 20 | |
| 0.240-0.259 | 29 | |
| 0.260-0.279 | 32 | |
| 0.280-0.299 | 30 | |
| 0.300-0.319 | 17 | |
| 0.320-0.339 | 5 | |
| 0.340-0.359 | 1 |
Hence, the cumulative frequency for National league is given by
| Batting average | National League Cumulative Frequency |
| 0.180-0.199 | 2 |
| 0.200-0.219 | 9 |
| 0.220-0.239 | 29 |
| 0.240-0.259 | 58 |
| 0.260-0.279 | 90 |
| 0.280-0.299 | 120 |
| 0.300-0.319 | 137 |
| 0.320-0.339 | 142 |
| 0.340-0.359 | 143 |
h.
To find: The frequency ogive for the National League frequency distribution.
Explanation of Solution
Given information:The following frequency distribution presents the batting averages of Major League Baseball players in both the American League and the National League who had 300 or more plate appearances during a recent season.
| Batting average | American LeagueFrequency | National LeagueFrequency |
| 0.180-0.199 | 2 | 2 |
| 0.200-0.219 | 7 | 7 |
| 0.220-0.239 | 21 | 20 |
| 0.240-0.259 | 30 | 29 |
| 0.260-0.279 | 26 | 32 |
| 0.280-0.299 | 21 | 30 |
| 0.300-0.319 | 12 | 17 |
| 0.320-0.339 | 5 | 5 |
| 0.340-0.359 | 0 | 1 |
Definition used: An ogive plots the cumulative frequencies.
Solution:
The table of cumulative National League frequency is given by
| Batting average | National League Cumulative Frequency |
| 0.180-0.199 | 2 |
| 0.200-0.219 | 9 |
| 0.220-0.239 | 29 |
| 0.240-0.259 | 58 |
| 0.260-0.279 | 90 |
| 0.280-0.299 | 120 |
| 0.300-0.319 | 137 |
| 0.320-0.339 | 142 |
| 0.340-0.359 | 143 |
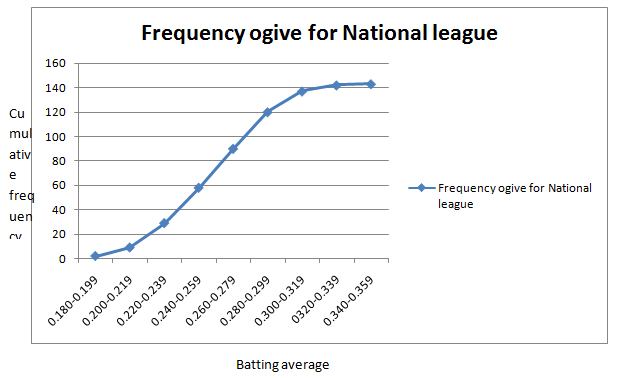
The frequency ogive for National League frequency distribution is given by

g.
To compute: The cumulative relative frequencies for the classes in the National league frequency distribution.
Answer to Problem 44E
| Batting average | Cumulative relative Frequency |
| 0.180-0.199 | 0.014 |
| 0.200-0.219 | 0.063 |
| 0.220-0.239 | 0.203 |
| 0.240-0.259 | 0.406 |
| 0.260-0.279 | 0.629 |
| 0.280-0.299 | 0.839 |
| 0.300-0.319 | 0.958 |
| 0.320-0.339 | 0.993 |
| 0.340-0.359 | 1.000 |
Explanation of Solution
Given information: The following frequency distribution presents the batting averages of Major League Baseball players in both the American League and the National League who had 300 or more plate appearances during a recent season.
| Batting average | American LeagueFrequency | National LeagueFrequency |
| 0.180-0.199 | 2 | 2 |
| 0.200-0.219 | 7 | 7 |
| 0.220-0.239 | 21 | 20 |
| 0.240-0.259 | 30 | 29 |
| 0.260-0.279 | 26 | 32 |
| 0.280-0.299 | 21 | 30 |
| 0.300-0.319 | 12 | 17 |
| 0.320-0.339 | 5 | 5 |
| 0.340-0.359 | 0 | 1 |
Definition used: The cumulative relative frequency of a class is given by
Calculation:
The cumulative classes are given by in the following table.
| Batting average | National League Cumulative Frequency | Cumulative relative frequency |
| 0.180-0.199 | 2 | |
| 0.200-0.219 | 9 | |
| 0.220-0.239 | 29 | |
| 0.240-0.259 | 58 | |
| 0.260-0.279 | 90 | |
| 0.280-0.299 | 120 | |
| 0.300-0.319 | 137 | |
| 0.320-0.339 | 142 | |
| 0.340-0.359 | 143 |
Hence, the cumulative relative frequency for National league is given by
| Batting average | Cumulative relative Frequency |
| 0.180-0.199 | 0.014 |
| 0.200-0.219 | 0.063 |
| 0.220-0.239 | 0.203 |
| 0.240-0.259 | 0.406 |
| 0.260-0.279 | 0.629 |
| 0.280-0.299 | 0.839 |
| 0.300-0.319 | 0.958 |
| 0.320-0.339 | 0.993 |
| 0.340-0.359 | 1.000 |
h.
To find: The relative frequency ogive for the National league frequency distribution.
Explanation of Solution
Given information:The following frequency distribution presents the batting averages of Major League Baseball players in both the American League and the National League who had 300 or more plate appearances during a recent season.
| Batting average | American LeagueFrequency | National LeagueFrequency |
| 0.180-0.199 | 2 | 2 |
| 0.200-0.219 | 7 | 7 |
| 0.220-0.239 | 21 | 20 |
| 0.240-0.259 | 30 | 29 |
| 0.260-0.279 | 26 | 32 |
| 0.280-0.299 | 21 | 30 |
| 0.300-0.319 | 12 | 17 |
| 0.320-0.339 | 5 | 5 |
| 0.340-0.359 | 0 | 1 |
Definition used:A relative frequency ogive plots the cumulative relative frequencies..
Solution:
The table of cumulative relative frequency for the National league frequency distribution is given by
| Batting average | Cumulative relative Frequency |
| 0.180-0.199 | 0.014 |
| 0.200-0.219 | 0.063 |
| 0.220-0.239 | 0.203 |
| 0.240-0.259 | 0.406 |
| 0.260-0.279 | 0.629 |
| 0.280-0.299 | 0.839 |
| 0.300-0.319 | 0.958 |
| 0.320-0.339 | 0.993 |
| 0.340-0.359 | 1.000 |
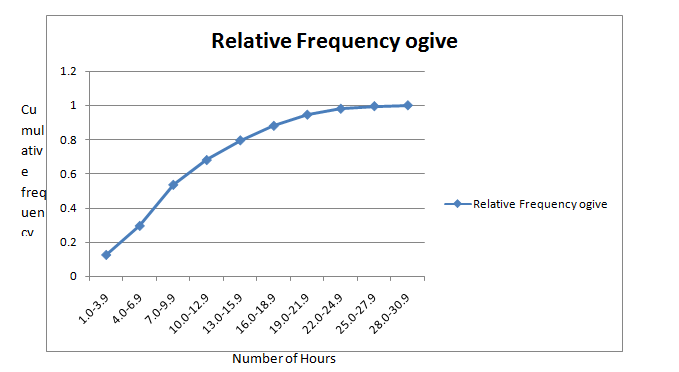
The relative frequency ogivefor National League is given by

Want to see more full solutions like this?
Chapter 2 Solutions
Elementary Statistics ( 3rd International Edition ) Isbn:9781260092561
- (b) Demonstrate that if X and Y are independent, then it follows that E(XY) E(X)E(Y);arrow_forward(d) Under what conditions do we say that a random variable X is integrable, specifically when (i) X is a non-negative random variable and (ii) when X is a general random variable?arrow_forward29. State the Borel-Cantelli Lemmas without proof. What is the primary distinction between Lemma 1 and Lemma 2?arrow_forward
- The masses measured on a population of 100 animals were grouped in the following table, after being recorded to the nearest gram Mass 89 90-109 110-129 130-149 150-169 170-189 > 190 Frequency 3 7 34 43 10 2 1 You are given that the sample mean of the data is 131.5 and the sample standard deviation is 20.0. Test the hypothesis that the distribution of masses follows a normal distribution at the 5% significance level.arrow_forwardstate without proof the uniqueness theorm of probability functionarrow_forward(a+b) R2L 2+2*0=? Ma state without proof the uniqueness theorm of probability function suppose thatPandQ are probability measures defined on the same probability space (Q, F)and that Fis generated by a π-system if P(A)=Q(A) tax for all A EthenP=Q i. e. P(A)=Q(A) for alla g // معدلة 2:23 صarrow_forward
 Holt Mcdougal Larson Pre-algebra: Student Edition...AlgebraISBN:9780547587776Author:HOLT MCDOUGALPublisher:HOLT MCDOUGAL
 Glencoe Algebra 1, Student Edition, 9780079039897...AlgebraISBN:9780079039897Author:CarterPublisher:McGraw Hill
 Big Ideas Math A Bridge To Success Algebra 1: Stu...AlgebraISBN:9781680331141Author:HOUGHTON MIFFLIN HARCOURTPublisher:Houghton Mifflin Harcourt


