
Videos
a.
Construct the percent frequency distribution of field of study for the various degrees.
a.
Answer to Problem 9E
The percent frequency distribution for bachelor’s degree is as follows:
| Bachelor’s degree | Percent frequency |
| B | 21% |
| CSE | 9% |
| E | 6% |
| H | 16% |
| NSM | 8% |
| O | 24% |
| SBS | 16% |
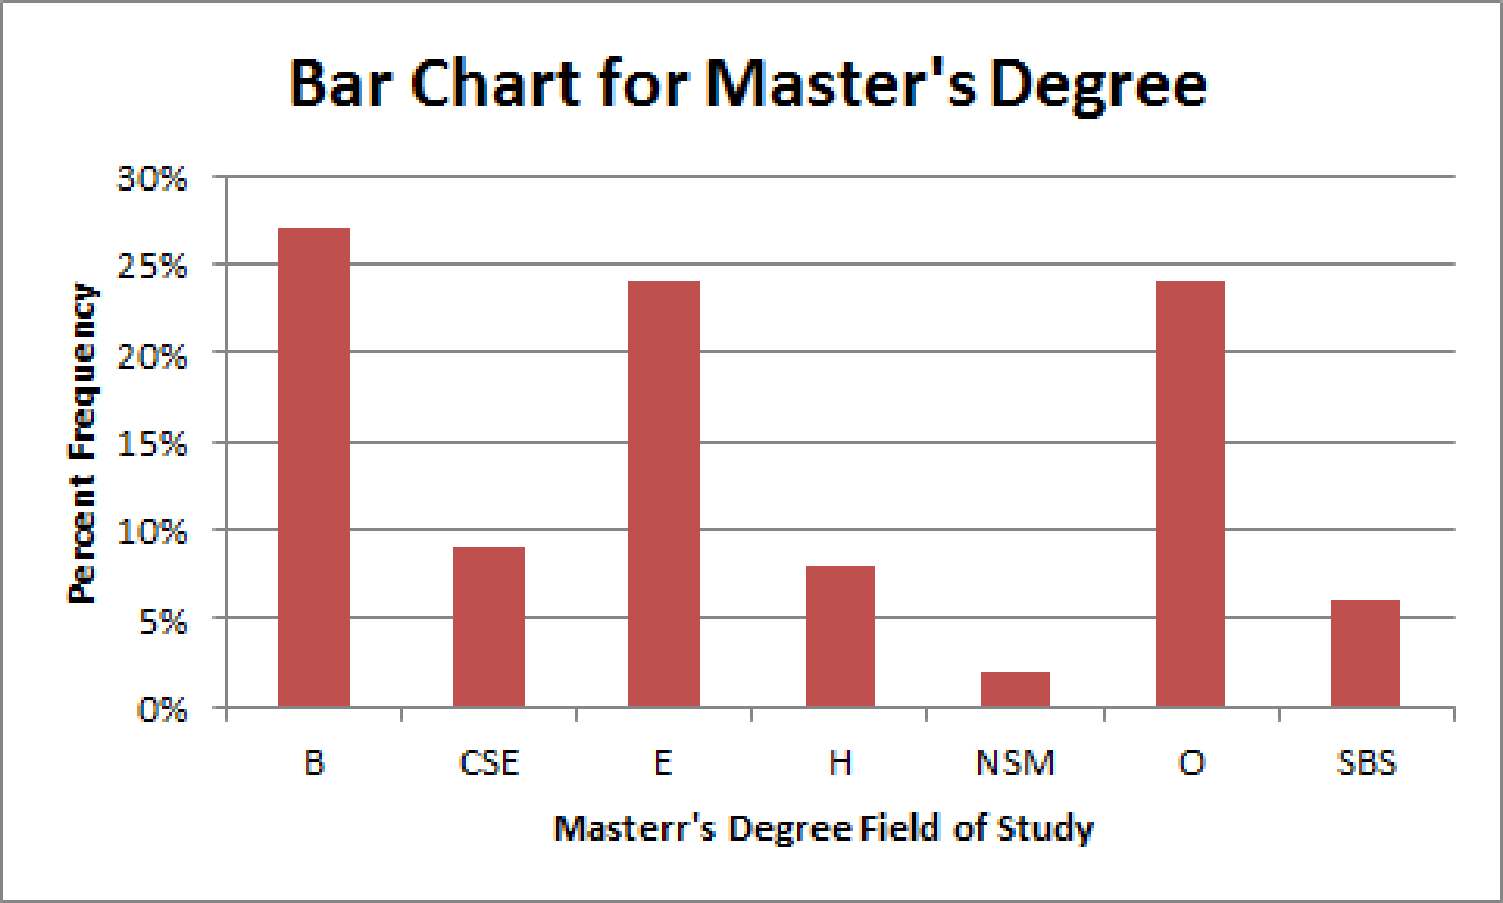
The percent frequency distribution for Master’s degree is as follows:
| Master’s degree | Percent frequency |
| B | 27% |
| CSE | 9% |
| E | 24% |
| H | 8% |
| NSM | 2% |
| O | 24% |
| SBS | 6% |
Explanation of Solution
Calculation:
The fields of studies in which a bachelor’s degrees and a master’s degree are provided, are given for a sample of 100 graduates. The respective categories are Business (B), Computer science and Engineering (CSE), Education (E), Natural sciences and Mathematics (NSM), Social and Behavioral sciences (SBS) and Other (O).
For Bachelor’s degree:
Frequency:
The frequencies are calculated by using the tally mark. Here, the number of times each class repeats is the frequency of that particular class.
Here, “B” is the category, which is repeated for 21 times in the data set and thus, 21 is the frequency for the category B.
Similarly, the frequencies of the remaining categories are given below:
| Bachelor’s degree | Tally | Frequency |
| B | 21 | |
| CSE | 9 | |
| E | 6 | |
| H | 16 | |
| NSM | 8 | |
| O | 24 | |
| SBS | 16 | |
| Total | 100 |
Relative frequency:
The general formula for the relative frequency is,
Therefore,
Similarly, the relative frequencies for the remaining types of classes are obtained below:
| Bachelor’s degree | Frequency | Relative frequency |
| B | 21 | |
| CSE | 9 | |
| E | 6 | |
| H | 16 | |
| NSM | 8 | |
| O | 24 | |
| SBS | 16 | |
| Total | 100 |
Percentage frequency distribution:
The general formula for the percent frequency is,
Therefore,
The percent frequencies for the remaining types of categories of education fields for Bachelor’s degree are obtained below:
| Bachelor’s degree | Relative frequency | Percent frequency |
| B | 0.21 | 21% |
| CSE | 0.09 | 9% |
| E | 0.06 | 6% |
| H | 0.16 | 16% |
| NSM | 0.08 | 8% |
| O | 0.24 | 24% |
| SBS | 0.16 | 16% |
| Total | 1.00 | 100 |
For Master’s degree:
Here, “B” is the department, which is repeated for 27 times in the data set and thus, 27 is the frequency for the category business (B).
Similarly, the frequencies of remaining types of departments are given below:
| Master’s degree | Tally | Frequency |
| B | 27 | |
| CSE | 9 | |
| E | 24 | |
| H | 8 | |
| NSM | 2 | |
| O | 24 | |
| SBS | 6 | |
| Total | 100 |
Relative frequency:
Similarly, the relative frequencies for the remaining types of classes (PPG) are obtained below:
| Master’s degree | Frequency | Relative frequency |
| B | 27 | |
| CSE | 9 | |
| E | 24 | |
| H | 8 | |
| NSM | 2 | |
| O | 24 | |
| SBS | 6 | |
| Total | 100 |
Percentage frequency distribution:
The percent frequencies for the remaining types of categories of education fields for Master’s degree are obtained below:
| Master’s degree | Relative Frequency | Percent frequency |
| B | 0.27 | 27% |
| CSE | 0.09 | 9% |
| E | 0.24 | 24% |
| H | 0.08 | 8% |
| NSM | 0.02 | 2% |
| O | 0.24 | 24% |
| SBS | 0.06 | 6% |
| Total | 1.00 | 100 |
b.
Construct the bar charts for the two degrees.
b.
Answer to Problem 9E
- The bar chart for Bachelor’s degree is given below:
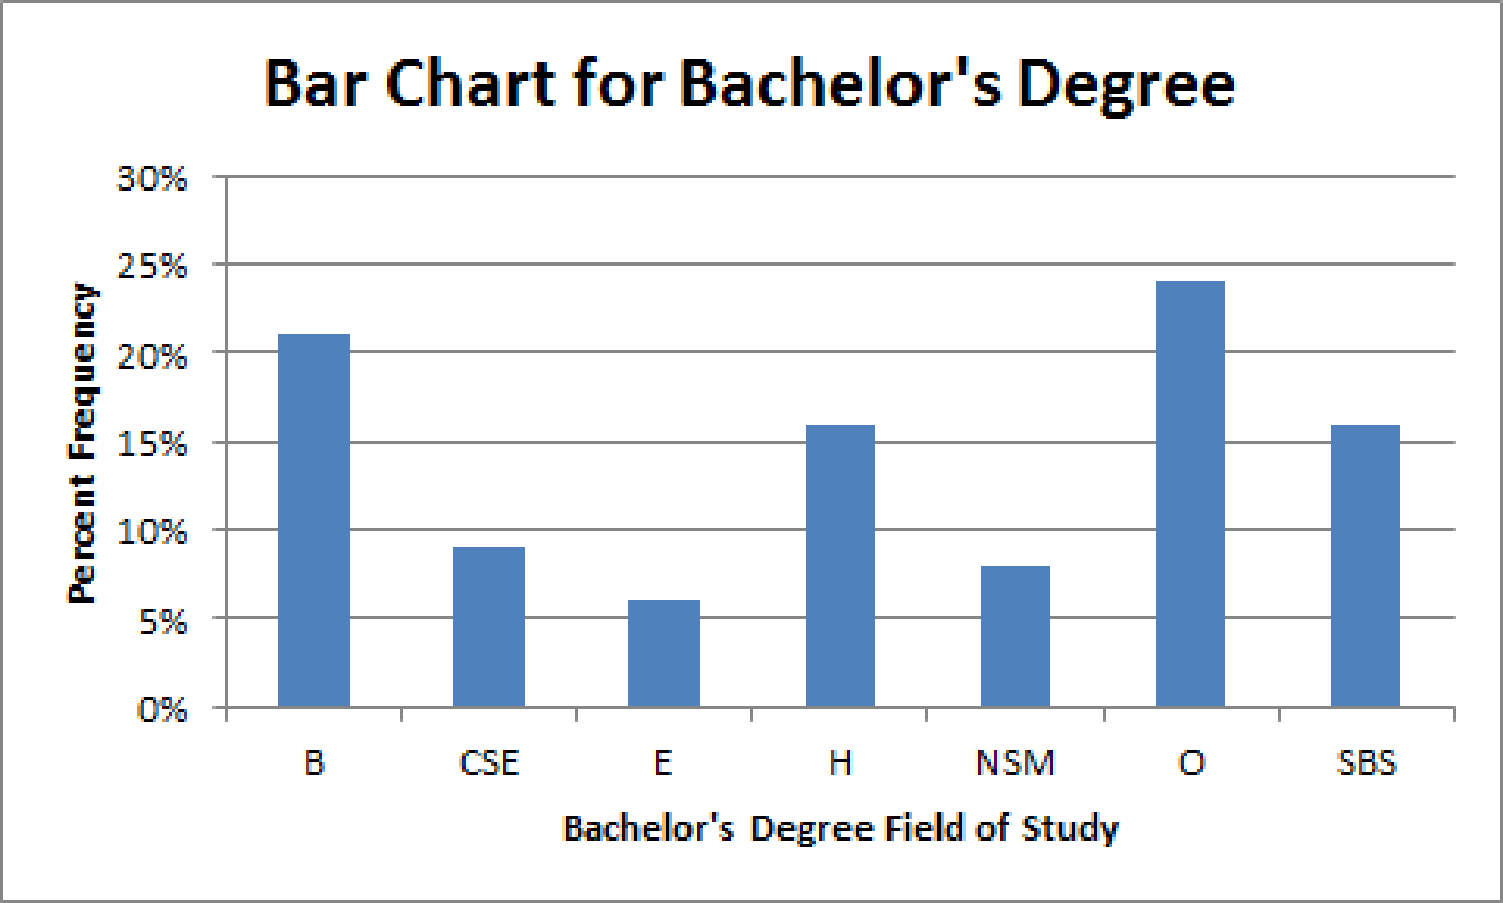
- The bar chart for Bachelor’s degree is given below:
Explanation of Solution
Calculation:
The bar charts can be obtained using software.
Bachelor’s degree:
Software procedure:
Step-by-step procedure to draw the bar chart using EXCEL software:
- Open an EXCEL sheet.
- Enter the fields of study in Bachelor’s degree and the corresponding frequencies in columns A and B respectively, under the headings of Bachelor’s degree in cell A1 and Percent Frequency in cell B1.
- Select the entered data along with the headings.
- Choose Insert > Column > 2-D Column > Clustered Column.
- Choose Layout > Chart Title > Above Chart and enter Bar Chart for Bachelor’s Degree.
- Choose Layout > Axis Title > Primary Horizontal Axis Title > Title Below Axis and enter Bachelor’s Degree Field of Study.
- Choose Layout > Axis Title > Primary Vertical Axis Title > Rotated Title and enter Percent Frequency.
Hence, the bar chart for the Bachelor’s degree data is obtained using EXCEL software.
- Master’s degree:
Software procedure:
Step-by-step procedure to draw the bar chart using EXCEL software:
- Open an EXCEL sheet.
- Enter the fields of study in Master’s degree and the corresponding frequencies in columns A and B respectively, under the headings of Master’s degree in cell A1 and Percent Frequency in cell B1.
- Select the entered data along with the headings.
- Choose Insert > Column > 2-D Column > Clustered Column.
- Choose Layout > Chart Title > Above Chart and enter Bar Chart for Master’s Degree.
- Choose Layout > Axis Title > Primary Horizontal Axis Title > Title Below Axis and enter Master’s Degree Field of Study.
- Choose Layout > Axis Title > Primary Vertical Axis Title > Rotated Title and enter Percent Frequency.
Hence, the bar chart for the Master’s degree data is obtained using EXCEL software.
c.
Find the lowest percentage field of study for each degree.
c.
Answer to Problem 9E
The lowest percentage field of study for a Bachelor’ degree is Education.
The lowest percentage field of study for a Master’s degree is Natural science and Mathematics.
Explanation of Solution
From the percent frequencies in Part a, it is found that for Bachelor’ degree, the percentage for Education (E) is 6%, which is the lowest when compared to the other categories.
For Master’s degree, the percentage for Natural science and Mathematics (NSM) is 2%, which is the lowest when compared to the other categories.
d.
Find the highest percentage field of study for each degree.
d.
Answer to Problem 9E
The highest percentage field of study for a Bachelor’ degree is Others.
The highest percentage field of study for a Master’s degree is Business.
Explanation of Solution
From the percent frequencies in Part a, it is found that for the Other (O) category, the percentage is 24%, which is the highest when compared to the other categories.
For Master’s degree, the percentage for Business (B) is 27%, which is the highest when compared to the other categories.
e.
Identify the field of study that has the largest increase in percentage from bachelor’s to masters’.
e.
Answer to Problem 9E
The field of study Education has the largest increase in percentage from bachelor’s to masters’.
Explanation of Solution
Calculation:
In order to the obtain the study field that has the largest increase in percentage from bachelor’s to Masters’ is calculated by obtaining the difference between two respective percentages.
Therefore,
The differences between two fields are tabulated below:
| Field | Bachelor’s | Master’s | Difference (Master’s – Bachelor’s) |
| B | 21% | 27% | (27 – 21)% = 6% |
| CSE | 9% | 9% | (9 – 9)% = 0% |
| E | 6% | 24% | (24 – 6)% = 18% |
| H | 16% | 8% | (8 – 16)% = –8% |
| NSM | 8% | 2% | (2 – 8)% = –6% |
| O | 24% | 24% | (24 – 24)% = 0% |
| SBS | 16% | 6% | (6 – 16)% = –10% |
From the table, it is observed that the field of study Education has the largest increase in percentage (6%) from bachelor’s to masters’ degree.
Want to see more full solutions like this?
Chapter 2 Solutions
Bundle: Modern Business Statistics with Microsoft Office Excel, Loose-Leaf Version, 6th + MindTap Business Statistics, 2 terms (12 months) Printed Access Card


- Negate the following compound statement using De Morgans's laws.arrow_forwardQuestion 6: Negate the following compound statements, using De Morgan's laws. A) If Alberta was under water entirely then there should be no fossil of mammals.arrow_forwardNegate the following compound statement using De Morgans's laws.arrow_forward
- Characterize (with proof) all connected graphs that contain no even cycles in terms oftheir blocks.arrow_forwardLet G be a connected graph that does not have P4 or C3 as an induced subgraph (i.e.,G is P4, C3 free). Prove that G is a complete bipartite grapharrow_forwardProve sufficiency of the condition for a graph to be bipartite that is, prove that if G hasno odd cycles then G is bipartite as follows:Assume that the statement is false and that G is an edge minimal counterexample. That is, Gsatisfies the conditions and is not bipartite but G − e is bipartite for any edge e. (Note thatthis is essentially induction, just using different terminology.) What does minimality say aboutconnectivity of G? Can G − e be disconnected? Explain why if there is an edge between twovertices in the same part of a bipartition of G − e then there is an odd cyclearrow_forward
- Let G be a connected graph that does not have P4 or C4 as an induced subgraph (i.e.,G is P4, C4 free). Prove that G has a vertex adjacent to all othersarrow_forwardWe consider a one-period market with the following properties: the current stock priceis S0 = 4. At time T = 1 year, the stock has either moved up to S1 = 8 (with probability0.7) or down towards S1 = 2 (with probability 0.3). We consider a call option on thisstock with maturity T = 1 and strike price K = 5. The interest rate on the money marketis 25% yearly.(a) Find the replicating portfolio (φ, ψ) corresponding to this call option.(b) Find the risk-neutral (no-arbitrage) price of this call option.(c) We now consider a put option with maturity T = 1 and strike price K = 3 onthe same market. Find the risk-neutral price of this put option. Reminder: A putoption gives you the right to sell the stock for the strike price K.1(d) An investor with initial capital X0 = 0 wants to invest on this market. He buysα shares of the stock (or sells them if α is negative) and buys β call options (orsells them is β is negative). He invests the cash balance on the money market (orborrows if the amount is…arrow_forwardDetermine if the two statements are equivalent using a truth tablearrow_forward
- Question 4: Determine if pair of statements A and B are equivalent or not, using truth table. A. (~qp)^~q в. р л~9arrow_forwardDetermine if the two statements are equalivalent using a truth tablearrow_forwardQuestion 3: p and q represent the following simple statements. p: Calgary is the capital of Alberta. A) Determine the value of each simple statement p and q. B) Then, without truth table, determine the va q: Alberta is a province of Canada. for each following compound statement below. pvq р^~q ~рл~q ~q→ p ~P~q Pq b~ (d~ ← b~) d~ (b~ v d) 0 4arrow_forward
 Glencoe Algebra 1, Student Edition, 9780079039897...AlgebraISBN:9780079039897Author:CarterPublisher:McGraw Hill
 Big Ideas Math A Bridge To Success Algebra 1: Stu...AlgebraISBN:9781680331141Author:HOUGHTON MIFFLIN HARCOURTPublisher:Houghton Mifflin Harcourt