
Videos
Cincinnati, Ohio, also known as the Queen City, has a population of approximately 298,000 and is the third largest city in the state of Ohio. The Cincinnati metropolitan area has a population of about 2.2 million. The city is governed by a mayor and a nine-member city council. The city manager, who is responsible for the day-to-day operation of the city, reports to the mayor and city council. The city manager recently created the Office of Performance and Data Analytics with the goal of improving the efficiency of city operations. One of the first tasks of this new office is to review the previous year’s expenditures. The file QueenCity contains data on the previous year’s expenditures, including the following:
Department: The number of the department incurring the expenditure
Department Description: The name of the department incurring the description
Category: The category of the expenditure
Fund: The fund to which the expenditure was charged
Expenditure: The dollar amount of the expense
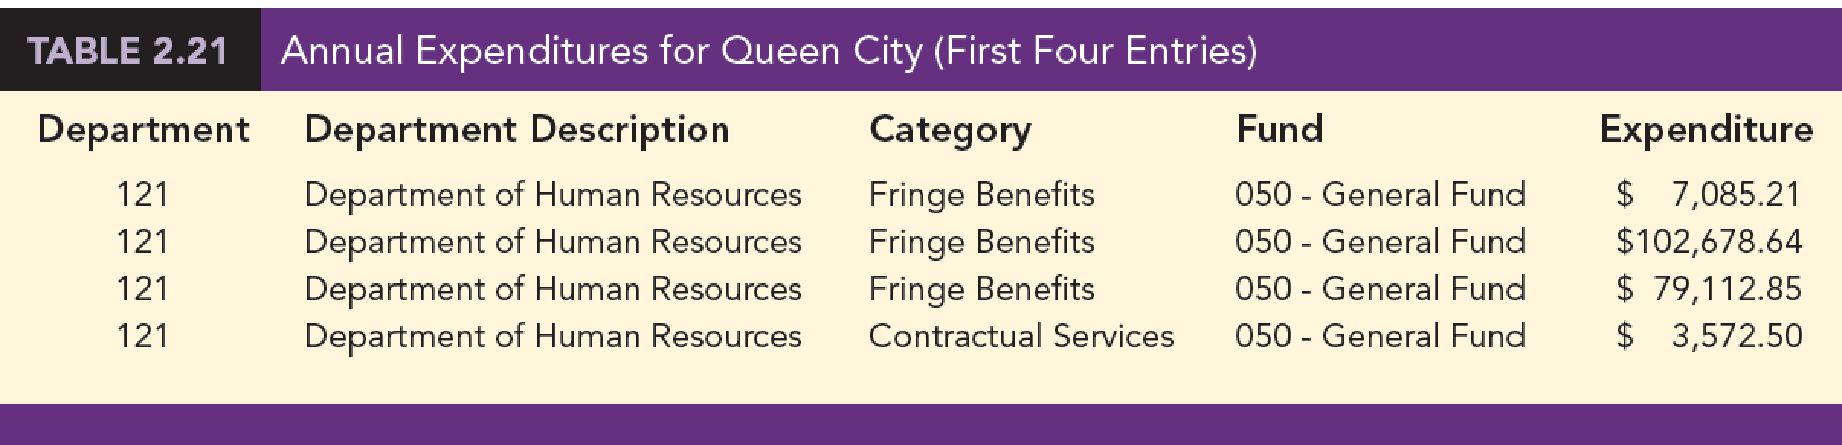
Table 2.21 shows the first four entries of the 5427 expenditures for the year. The city manager would like to use this data to better understand how the city’s budget is being spent.
Manageri al Report
Use tabular and graphical methods of
- 1. Tables and/or graphical displays that show the amount of expenditures by category and percentage of total expenditures by category.
- 2. A table that shows the amount of expenditures by department and the percentage of total expenditures by department. Combine any department with less than 1% into a category named “Other.”
- 3. A table that shows the amount of expenditures by fund and the percentage of total expenditures by fund. Combine any fund with less than 1% into a category named “Other.”
1.
Make tabular and graphical displays that show the amount of expenditure by category and percentage of total expenditures by category.
Answer to Problem 3CP
The following table represents the total amount of expenditure by category and percentage of total expenditures by category:
| Category | Total expenditure | Percentage of total expenditure |
| Capital | $198,365,854 | 29.98% |
| Payroll | $145,017,555 | 21.92% |
| Debt service | $86,913,978 | 13.14% |
| Contractual services | $85,043,249 | 12.85% |
| Fringe benefits | $66,053,340 | 9.98% |
| Fixed costs | $53,732,177 | 8.12% |
| Materials and supplies | $19,934,710 | 3.01% |
| Inventory | $6,393,394 | 0.97% |
| Payables | $180,435 | 0.03% |
| Grand Total | $661,634,693 | 100.0% |
The bar chart for “Category” is given below:

Explanation of Solution
Calculation:
The table represents the sample of 5,427 entries and the annual expenditures for queen city (City C and City O) for the year. The five types of variables present in the data are department serial number, department description, category name, fund, and expenditure.
From the data set, the variable “Category” consists of nine entities, namely capital, payroll, debt service, contractual services, fringe benefits, fixed costs, materials and supplies, inventory, and payable.
Therefore, the following table shows the amount of all nine entities’ total expenditure by category:
| Category | Total expenditure |
| Capital | $198,365,854 |
| Payroll | $145,017,555 |
| Debt service | $86,913,978 |
| Contractual services | $85,043,249 |
| Fringe benefits | $66,053,340 |
| Fixed costs | $53,732,177 |
| Materials and supplies | $19,934,710 |
| Inventory | $6,393,394 |
| Payables | $180,435 |
| Grand Total | $661,634,693 |
The percentage for capital is calculated as the ratio of total expenditure for capital to the grand totals of all categories.
The following table shows the percentage of amount of all nine entities’ total expenditure by category:
| Category | Total expenditure | Percentage of total expenditure |
| Capital | $198,365,854 | 29.98% |
| Payroll | $145,017,555 | 21.92% |
| Debt service | $86,913,978 | 13.14% |
| Contractual services | $85,043,249 | 12.85% |
| Fringe benefits | $66,053,340 | 9.98% |
| Fixed costs | $53,732,177 | 8.12% |
| Materials and supplies | $19,934,710 | 3.01% |
| Inventory | $6,393,394 | 0.97% |
| Payables | $180,435 | 0.03% |
| Grand Total | $661,634,693 | 100.0% |
Software procedure:
Step-by-step software procedure to obtain the bar chart for category using EXCEL software:
- In Excel sheet, enter Category in one column and Percentage of total Expenditure in another column.
- Select the data, and then choose Insert > Insert Column Bar Charts.
- Select Clustered Column under More Column Charts.
Output using the EXCEL software is given below:
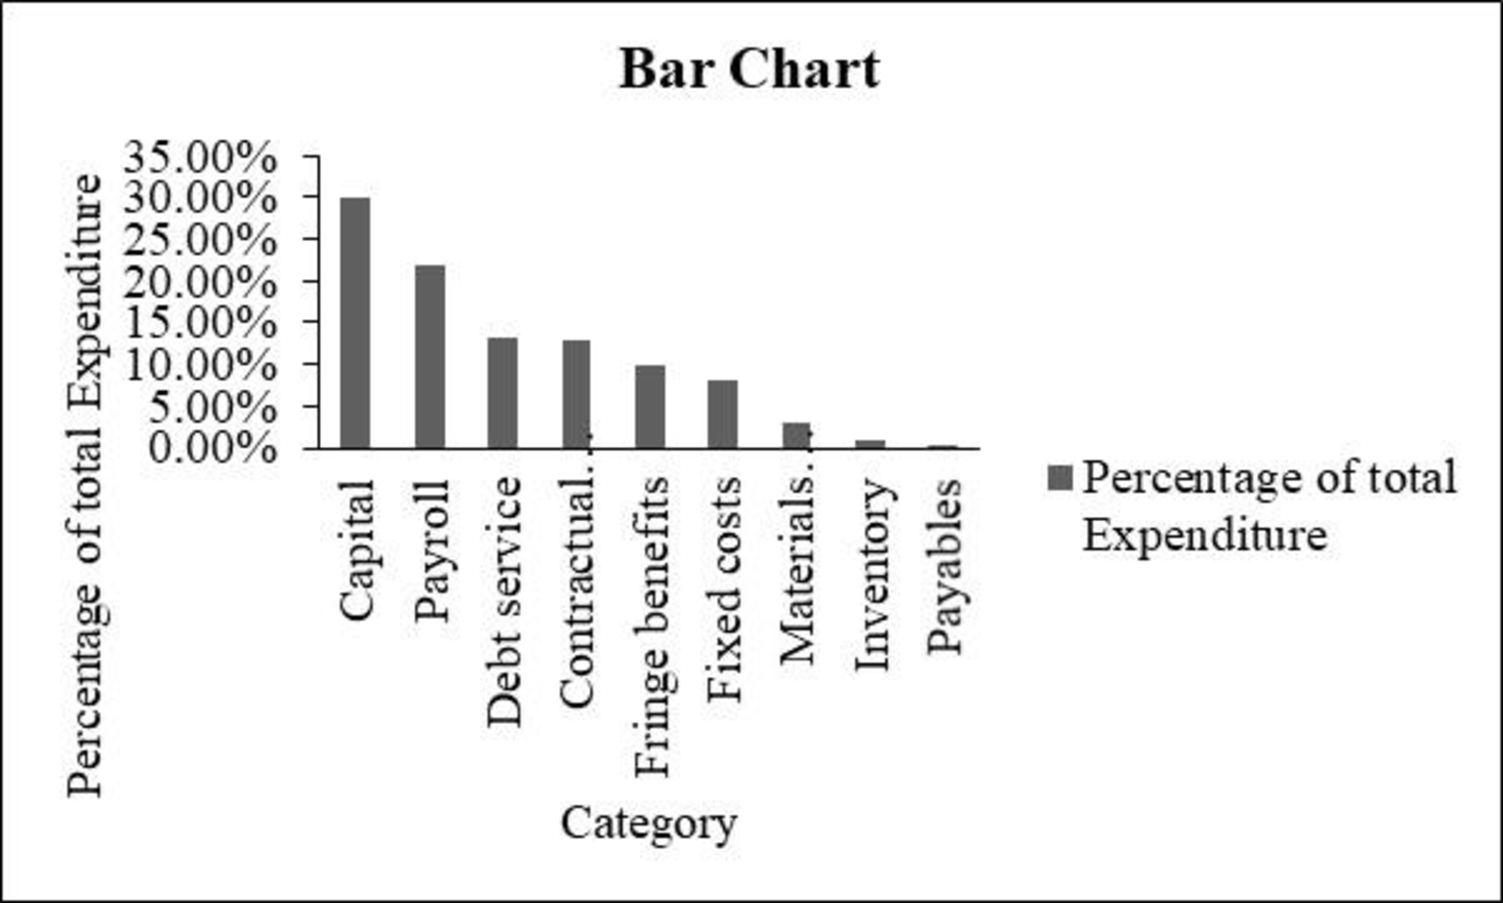
From the obtained table and bar chart, it can be observed that the sum of capital expenditures and payroll contributes 50% of all expenditures.
Also, the total expenditures are over $660 million. Debt service seems to be high, and it is found to be over 10% of total expenditures.
2.
Make tabular displays that show the amount of expenditure by department and percentage of total expenditures by department.
Answer to Problem 3CP
The following table represents the total amount of expenditure by department and percentage of total expenditures by department:
| Department description | Percentage of total expenditure | Total expenditure |
| Department of Police | 9.72% | 64,295,941 |
| Department of Sewers | 8.76% | 57,954,955 |
| Transportation and Engineering | 8.72% | 57,686,199 |
| Department of Fire | 7.23% | 47,838,396 |
| Sewers, Debt Service | 6.59% | 43,585,814 |
| Finance, Risk Management | 5.39% | 35,654,238 |
| SORTA Operations | 3.62% | 23,975,000 |
| Water Works, Debt Service | 3.24% | 21,418,102 |
| Department of Water Works | 3.07% | 20,307,505 |
| Finance, Treasury | 2.80% | 18,531,650 |
| Economic Development | 2.13% | 14,078,735 |
| Division of Parking Facilities | 1.89% | 12,489,731 |
| Community Development, Housing | 1.75% | 11,556,943 |
| Enterprise Technology Solutions | 1.71% | 11,314,215 |
| Public Services, Fleet Services | 1.66% | 10,982,312 |
| Finance, Accounts & Audits | 1.66% | 10,960,345 |
| Transportation and Engineering, Planning | 1.63% | 10,764,138 |
| Public Services, Neighborhood Operations | 1.38% | 9,140,769 |
| Sewers, Millcreek | 1.30% | 8,575,226 |
| Health, Primary Health Care Centers | 1.25% | 8,268,632 |
| Water Works, Water Supply | 1.19% | 7,883,099 |
| Public Services, Facilities Management | 1.13% | 7,469,863 |
| Sewers, Wastewater Administration | 1.01% | 6,668,240 |
| Other department less than 1 percent each | 21.2% | 140,234,644 |
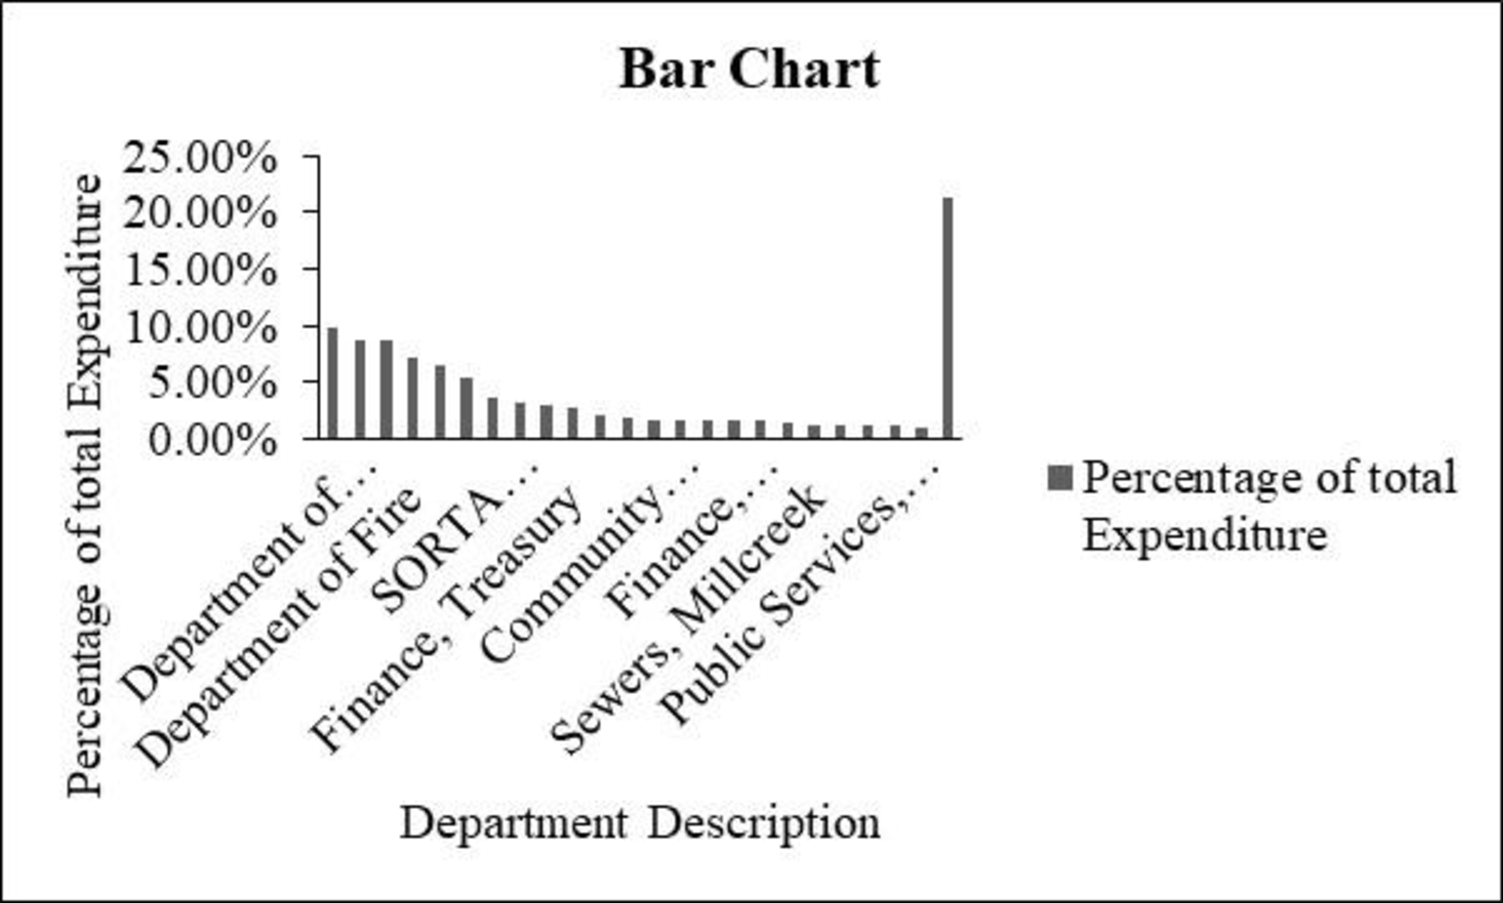
The bar chart for “Department description” is given below:

Explanation of Solution
Calculation:
Here, any departments with less than 1% are combined into a category named “other”.
Department description with less than 1% is tabulated as follows and named as “other”:
| Other (department description less than 1%) | Percentage of total expenditure | Total expenditure |
| Water Works, Distribution | 0.98% | 6,490,554 |
| Public Services, Traffic and Road Operations | 0.89% | 5,884,799 |
| Parks, Administrative and Program Services | 0.87% | 5,744,316 |
| Water Works, Commercial Services | 0.81% | 5,360,380 |
| Sewers, Wastewater Collection | 0.81% | 5,331,756 |
| Sewers, Director/Storm water | 0.79% | 5,213,170 |
| Parks, Operations and Facility Mgmt | 0.76% | 5,008,200 |
| Police Emergency Communications | 0.69% | 4,557,589 |
| Division of Convention Center | 0.67% | 4,460,267 |
| Health, Primary Health Care Programs | 0.58% | 3,821,334 |
| Health, Community Health Services | 0.56% | 3,675,649 |
| Sewers, Maintenance | 0.55% | 3,668,040 |
| Water Works, Water Quality and Treatment | 0.51% | 3,395,988 |
| Recreation, Support Services | 0.50% | 3,315,938 |
| Law Department | 0.47% | 3,078,594 |
| Recreation, Golf | 0.42% | 2,781,652 |
| Water Works, Business Services | 0.41% | 2,693,873 |
| New Construction & Building Standards | 0.40% | 2,677,798 |
| Water Works, Engineering | 0.39% | 2,583,805 |
| Division of Traffic Engineering | 0.38% | 2,504,453 |
| Cincinnati Public School Reserve | 0.38% | 2,500,000 |
| Sewers, Little Miami | 0.37% | 2,439,869 |
| Planning, Licenses & Permits | 0.36% | 2,371,973 |
| Workers' Compensation Insurance | 0.33% | 2,214,094 |
| Motorized and Construction Equipment | 0.33% | 2,187,298 |
| Recreation, Maintenance | 0.33% | 2,162,545 |
| General Fund Overhead | 0.32% | 2,095,756 |
| Health, Primary School &Adolescent | 0.31% | 2,074,254 |
| Community Development Administration | 0.30% | 1,968,773 |
| Sewers, Industrial Waste | 0.28% | 1,841,374 |
| Office of the City Manager | 0.26% | 1,712,437 |
| Sewers, Project Delivery | 0.25% | 1,682,688 |
| Finance, Purchasing | 0.24% | 1,600,148 |
| Recreation, Athletics | 0.24% | 1,582,290 |
| Office of Environmental Qualities | 0.23% | 1,548,437 |
| Recreation, West Region | 0.22% | 1,487,931 |
| Finance, Income Tax | 0.22% | 1,483,479 |
| Health, Commissioner | 0.21% | 1,418,825 |
| Recreation, Central Region | 0.21% | 1,393,663 |
| Recreation, East Region | 0.20% | 1,350,682 |
| Community Development | 0.20% | 1,337,001 |
| Sewers, Muddy Creek | 0.18% | 1,211,584 |
| Health, Technical Resources | 0.17% | 1,122,229 |
| Sewers, Planning | 0.17% | 1,092,095 |
| Enterprise Software and Licenses | 0.16% | 1,082,024 |
| Water Works, IT | 0.16% | 1,039,488 |
| Sewers, Wastewater Engineering | 0.15% | 973,882 |
| Department of Human Resources | 0.14% | 929,460 |
| Department Of Planning & Buildings | 0.14% | 911,988 |
| Office and Technical Equipment | 0.13% | 863,762 |
| Bond Fund — Principal and Interest | 0.12% | 774,523 |
| Sewers, Sycamore | 0.11% | 754,132 |
| Transportation and Engineering Director | 0.11% | 720,092 |
| Division of Aviation | 0.11% | 702,480 |
| Budget & Evaluation | 0.08% | 562,270 |
| Sewers, Polk Run | 0.08% | 532,890 |
| Sewers, Taylor Creek | 0.08% | 529,774 |
| Citizens' Complaint Authority | 0.07% | 431,449 |
| Sewers, Superintendent | 0.06% | 428,268 |
| Contribution to Fire Pension | 0.06% | 416,783 |
| Contribution to Police Pension | 0.06% | 400,439 |
| Public Services, Director | 0.06% | 397,815 |
| Port Authority Greater Cincinnati Development | 0.05% | 350,000 |
| City Council | 0.05% | 337,658 |
| Hamilton Co. Auditor & Treasurer Fees | 0.05% | 298,758 |
| Office of The Clerk of Council | 0.04% | 293,185 |
| Office of The Mayor | 0.04% | 287,622 |
| Lump Sum Payments | 0.04% | 252,054 |
| Finance Director’s Office | 0.03% | 213,548 |
| County Clerk Fees | 0.03% | 175,000 |
| Public Employees Assistance Program | 0.02% | 161,711 |
| Police and Fire Fighter's Insurance | 0.02% | 115,000 |
| Parks, Office of Director | 0.01% | 94,987 |
| Special Investigations/Studies | 0.01% | 92,210 |
| Councilmember PG Sittenfeld | 0.01% | 77,451 |
| Surplus | 0.01% | 76,091 |
| Councilmember Y. Simpson | 0.01% | 70,985 |
| Councilmember W. Young | 0.01% | 63,012 |
| Councilmember R. Qualls | 0.01% | 62,862 |
| Councilmember C. Seelbach | 0.01% | 60,177 |
| Councilmember Quinlivan | 0.01% | 57,685 |
| Councilmember C. Winburn | 0.01% | 57,654 |
| Downtown Special Improvement District | 0.01% | 56,000 |
| Memberships & Publications | 0.01% | 53,150 |
| Cincinnati Music Hall | 0.01% | 50,000 |
| Election Expense | 0.01% | 46,580 |
| Convention Facility Authority | 0.01% | 45,700 |
| Councilmember C. Thomas | 0.01% | 45,603 |
| Councilmember C. Smitherman | 0.01% | 43,141 |
| Mayor's Office Obligations | 0.01% | 41,194 |
| State Unemployment Comp | 0.00% | 31,671 |
| Manager's Office Obligations | 0.00% | 13,956 |
| Councilmember P. Thomas | 0.00% | 13,168 |
| Judgments Against the City | 0.00% | 7,644 |
| Department of Public Recreation | 0.00% | 5,093 |
| Audit & Examiners Fees | 0.00% | 5,000 |
From the data set, the variable “department description” has 119 different departments, out of which 96 departments’ percentage is less than 1.
Therefore, the following table shows the expenditure of all 119 different departments:
| Department description | Total expenditure |
| Department of Police | 64,295,941 |
| Department of Sewers | 57,954,955 |
| Transportation and Engineering | 57,686,199 |
| Department of Fire | 47,838,396 |
| Sewers, Debt Service | 43,585,814 |
| Finance, Risk Management | 35,654,238 |
| SORTA Operations | 23,975,000 |
| Water Works, Debt Service | 21,418,102 |
| Department of Water Works | 20,307,505 |
| Finance, Treasury | 18,531,650 |
| Economic Development | 14,078,735 |
| Division of Parking Facilities | 12,489,731 |
| Community Development, Housing | 11,556,943 |
| Enterprise Technology Solutions | 11,314,215 |
| Public Services, Fleet Services | 10,982,312 |
| Finance, Accounts & Audits | 10,960,345 |
| Transportation and Engineering, Planning | 10,764,138 |
| Public Services, Neighborhood Operations | 9,140,769 |
| Sewers, Millcreek | 8,575,226 |
| Health, Primary Health Care Centers | 8,268,632 |
| Water Works, Water Supply | 7,883,099 |
| Public Services, Facilities Management | 7,469,863 |
| Sewers, Wastewater Administration | 6,668,240 |
| Other department less than 1 percent each | 140,234,644 |
| Grand Total | 661,634,692 |
The percentage for department description is calculated as the ratio of total expenditure to the grand total of all departments.
Therefore, the following table shows the percentage of amount of all department total expenditure by department:
| Department description | Percentage of total expenditure |
| Department of Police | 9.72% |
| Department of Sewers | 8.76% |
| Transportation and Engineering | 8.72% |
| Department of Fire | 7.23% |
| Sewers, Debt Service | 6.59% |
| Finance, Risk Management | 5.39% |
| SORTA Operations | 3.62% |
| Water Works, Debt Service | 3.24% |
| Department of Water Works | 3.07% |
| Finance, Treasury | 2.80% |
| Economic Development | 2.13% |
| Division of Parking Facilities | 1.89% |
| Community Development, Housing | 1.75% |
| Enterprise Technology Solutions | 1.71% |
| Public Services, Fleet Services | 1.66% |
| Finance, Accounts & Audits | 1.66% |
| Transportation and Engineering, Planning | 1.63% |
| Public Services, Neighborhood Operations | 1.38% |
| Sewers, Millcreek | 1.30% |
| Health, Primary Health Care Centers | 1.25% |
| Water Works, Water Supply | 1.19% |
| Public Services, Facilities Management | 1.13% |
| Sewers, Wastewater Administration | 1.01% |
| Other department less than 1 percent each | 21.2% |
Software procedure:
Step-by-step software procedure to obtain bar chart for department using EXCEL software:
- In Excel sheet, enter Department Description in one column and Percentage of total Expenditure in another column.
- Select the data, and then choose Insert > Insert Column Bar Charts.
- Select Clustered Column under More Column Charts.
Output using the Excel is given below:
Interpretation:
- From the obtained table and bar chart, it can be observed that 96 departments are showing total expenditure less than 1% over 119 departments.
- There are six individual departments, namely police, sewers, transportation and engineering, fire, sewer debt service, and financial/risk management, They have the total expenditure approximately 5 percent and more.
- Further, other department less than 1 percent each seems to be high, in terms of total expenditure percentage.
3.
Make tabular displays that show the amount of expenditure by fund and percentage of total expenditures by fund and combine any department with less than 1% into a category named “other”.
Answer to Problem 3CP
The following table represents the total amount of expenditure by fund and percentage of total expenditures by fund:
| Fund | Total expenditure | Percentage of total expenditure |
| 050 - general fund | 168,607,659 | 25.5% |
| 980 - capital projects | 106,180,470 | 16.0% |
| 701 - metropolitan sewer district of greater Cincinnati | 83,713,741 | 12.7% |
| 704 - metropolitan sewer district capital improvements | 57,954,955 | 8.8% |
| 101 - water works | 52,292,202 | 7.9% |
| 711 - risk management | 32,380,425 | 4.9% |
| 759 - income tax - transit | 24,239,259 | 3.7% |
| 151 - bond retirement - city | 15,584,916 | 2.4% |
| 202 - fleet services | 10,994,649 | 1.7% |
| 898 - water works improvement 12 | 8,483,304 | 1.3% |
| 897 - water works improvement 11 | 8,434,379 | 1.3% |
| 302 - income tax - infrastructure | 7,102,773 | 1.1% |
| other (less than 1% each) | 8,56,65,960 | 12.9% |
| Grand Total | 661,634,693 | 100.0% |
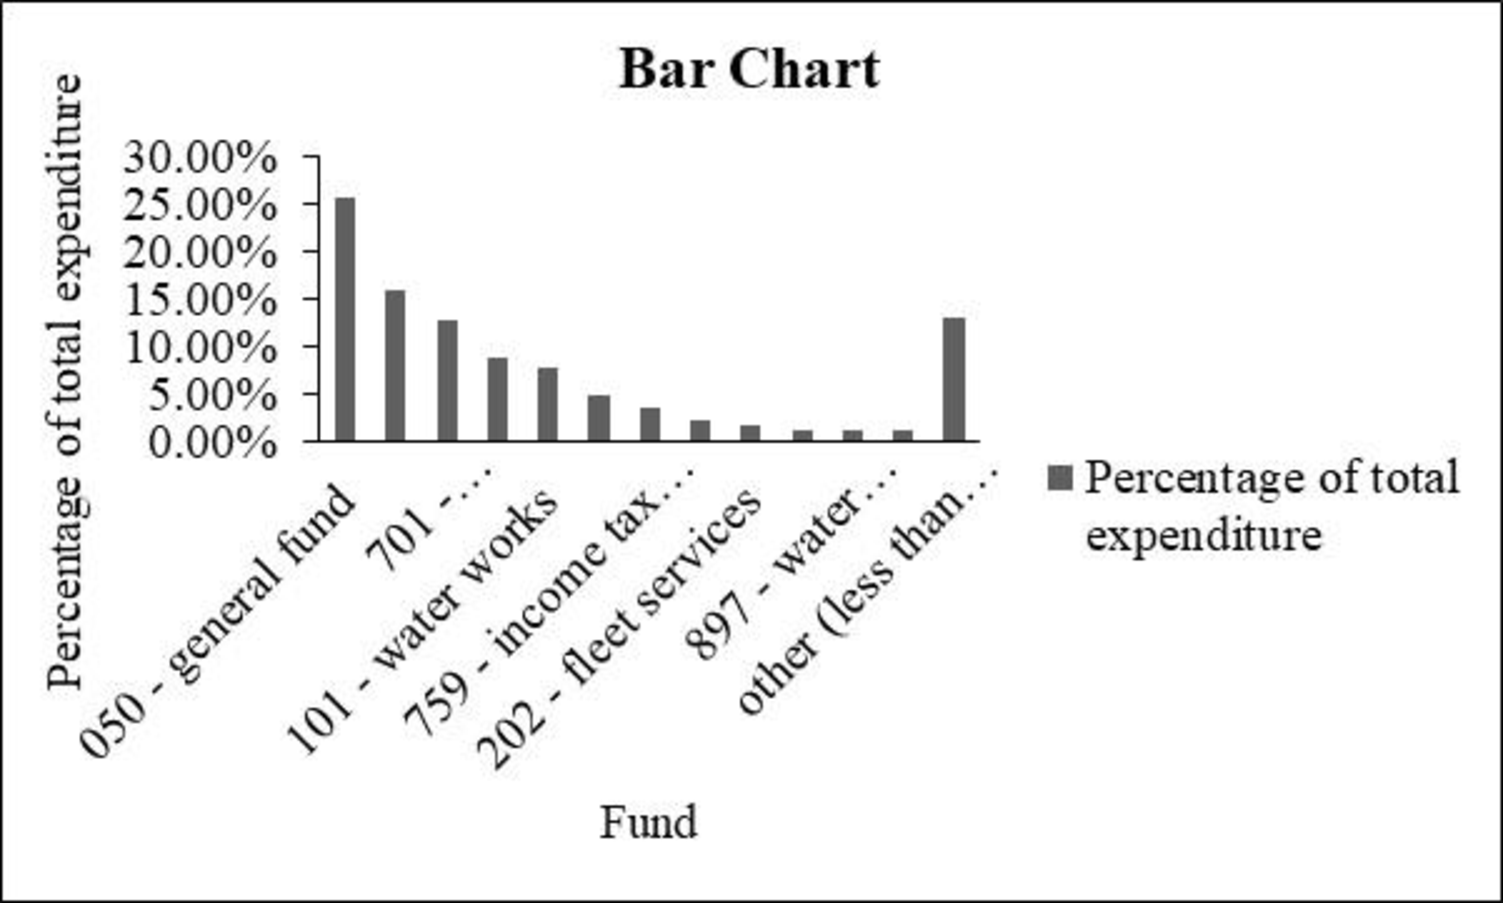
The bar chart for “Fund” is given below:

Explanation of Solution
Calculation:
Fund with less than 1% is tabulated below and named as “other”:
| Other (Fund less than 1%) | Total expenditure | Percentage of total expenditure |
| 155 – u square revenue bonds -trustee | 4,748,810 | 0.80% |
| 304 - community development block grant | 4,696,312 | 0.70% |
| 301 - street construction, maintenance and repair | 4,053,506 | 0.70% |
| 103 - duke energy convention center | 3,508,157 | 0.60% |
| 102 - parking system facilities | 3,388,305 | 0.50% |
| 702 - enterprise technology solutions | 3,216,237 | 0.50% |
| 762 - urban redevelopment tax increment equivalent | 2,816,029 | 0.50% |
| 105 - municipal golf activities | 2,596,303 | 0.40% |
| 395 - health services | 2,411,634 | 0.40% |
| 107 – storm water management | 2,325,888 | 0.40% |
| 368 - law enforcement grant | 2,222,595 | 0.40% |
| 410 - shelter plus care program | 2,162,535 | 0.30% |
| 449 - Cincinnati area’s geographic information system (cagis) | 2,159,283 | 0.30% |
| 353 - home health services | 2,099,548 | 0.30% |
| 457 - clear fund | 1,957,914 | 0.30% |
| 213 - worker's compensation | 1,817,200 | 0.30% |
| 758 - income tax permanent improvement fund | 1,766,123 | 0.30% |
| 214 - water works stores - chemicals | 1,526,281 | 0.30% |
| 204 - water works stores - materials | 1,506,447 | 0.20% |
| 391 - women and infants food grant program | 1,426,434 | 0.20% |
| 472 - fire grants | 1,362,498 | 0.20% |
| 307 - convention center expansion tax | 1,296,800 | 0.20% |
| 212 - employee safety and risk management | 1,216,265 | 0.20% |
| 491 - municipal public improvement equivalent fund | 1,212,813 | 0.20% |
| 438 - neighborhood stabilization program | 1,211,603 | 0.20% |
| 795 - downtown special improvement district | 1,202,786 | 0.20% |
| 201 - printing services/ stores | 1,141,805 | 0.20% |
| 306 - municipal motor vehicle license tax | 1,077,283 | 0.20% |
| 323 - recreation special activities | 1,069,119 | 0.20% |
| 411 - home investment trust | 991,223 | 0.20% |
| 349 - urban renewal debt retirement | 979,853 | 0.10% |
| 350 - public health research | 851,919 | 0.10% |
| 418 - federal health program income | 848,578 | 0.10% |
| 792 - forestry | 740,592 | 0.10% |
| 340 - centennial operations | 724,704 | 0.10% |
| 757 - miscellaneous permanent improvement fund | 662,729 | 0.10% |
| 104 - lunken airport | 586,663 | 0.10% |
| 487 - cuf/heights equivalent fund | 562,261 | 0.10% |
| 483 - downtown/otr east equivalent fund | 558,694 | 0.10% |
| 156 - fountain square west revenue bonds - trustee | 557,577 | 0.10% |
| 412 - food service license fees | 550,645 | 0.10% |
| 369 - criminal activity forfeiture - state | 523,925 | 0.10% |
| 488 –Coryville equivalent fund | 519,767 | 0.10% |
| 502 - arra federal grants | 509,814 | 0.10% |
| 445 - emergency shelter | 453,541 | 0.10% |
| 465 - housing opportunities for persons with aids | 373,929 | 0.10% |
| 498 –Madisonville equivalent fund | 363,449 | 0.10% |
| 332 - krohn conservatory | 302,862 | 0.10% |
| 364 - 911 cell phone fees | 299,652 | 0.00% |
| 381 - Cincinnati abatement project | 284,022 | 0.00% |
| 317 - urban development - property operations | 228,247 | 0.00% |
| 461 - fema grant | 219,424 | 0.00% |
| 793 - boulevard light energy and maintenance (blem) | 183,378 | 0.00% |
| 324 - recreation federal grant projects | 178,387 | 0.00% |
| 166 - greeters revenue bonds - trustee | 176,113 | 0.00% |
| 326 - park donations and special activity | 171,770 | 0.00% |
| 210 - highway maintenance stores | 169,814 | 0.00% |
| 342 - new city buildings operations | 167,023 | 0.00% |
| 420 - public employee assistance program | 165,141 | 0.00% |
| 446 - health network | 164,337 | 0.00% |
| 209 - property management | 162,435 | 0.00% |
| 618 - towing charges - private operators | 150,000 | 0.00% |
| 314 - special events | 146,679 | 0.00% |
| 481 - downtown south/riverfront equivalent fund | 144,066 | 0.00% |
| 367 - criminal activity forfeiture - federal | 131,116 | 0.00% |
| 753 - expressways/gateways | 126,717 | 0.00% |
| 486 - east walnut hills equivalent fund | 125,855 | 0.00% |
| 499 - Oakley equivalent fund | 123,924 | 0.00% |
| 436 - environmental studies | 122,482 | 0.00% |
| 318 - sawyer point | 115,771 | 0.00% |
| 330 - park lodge/pavilion deposits | 102,413 | 0.00% |
| 482 - downtown/otr west equivalent fund | 97,418 | 0.00% |
| 756 - water works capital | 78,225 | 0.00% |
| 485 - walnut hills equivalent fund | 77,402 | 0.00% |
| 207 - recreation stores | 76,091 | 0.00% |
| 161 - msd debt service - trustee - multi series | 71,262 | 0.00% |
| 752 - park board | 69,499 | 0.00% |
| 415 - immunization action plan | 63,781 | 0.00% |
| 478 - justice assistance grant | 56,049 | 0.00% |
| 425 - heart health in hamilton county project | 48,994 | 0.00% |
| 387 - lead hazard control research grant | 48,025 | 0.00% |
| 791 - sidewalks | 45,700 | 0.00% |
| 715 - convention facility authority | 44,830 | 0.00% |
| 454 –metropolitan medical response | 42,877 | 0.00% |
| 428 - urban forestry | 41,771 | 0.00% |
| 448 - health care services for the homeless | 41,475 | 0.00% |
| 370 - drug offender fines | 39,325 | 0.00% |
| 363 - solid waste disposal control | 38,714 | 0.00% |
| 490 - Evanston equivalent fund | 37,825 | 0.00% |
| 354 - household sewage treatment fees | 35,989 | 0.00% |
| 380 - lead poisoning control | 35,194 | 0.00% |
| 394 - state health program income | 29,632 | 0.00% |
| 413 - swimming pool license fees | 26,801 | 0.00% |
| 476 - uasi grant | 25,094 | 0.00% |
| 405 - market facilities | 24,099 | 0.00% |
| 389 - communications and marketing activities | 22,805 | 0.00% |
| other (less than 1% each) | 85,665,960 | 12.9% |
From the above table, the other category has the total expenditure of $85,665,960.
Therefore, the following table shows the amount of all 13 entities’ total expenditure by fund:
| Fund | Total expenditure |
| 050 - general fund | 168,607,659 |
| 980 - capital projects | 106,180,470 |
| 701 - metropolitan sewer district of greater Cincinnati | 83,713,741 |
| 704 - metropolitan sewer district capital improvements | 57,954,955 |
| 101 - water works | 52,292,202 |
| 711 - risk management | 32,380,425 |
| 759 - income tax – transit | 24,239,259 |
| 151 - bond retirement – city | 15,584,916 |
| 202 - fleet services | 10.994,649 |
| 898 - water works improvement 12 | 8,483,304 |
| 897 - water works improvement 11 | 8,434,379 |
| 302 - income tax – infrastructure | 7,102,773 |
| other (less than 1% each) | 85,665,960 |
| Total | 661,634,693 |
The percentage for fund is calculated as the ratio of total expenditure to the grand totals all funds.
Therefore, the following table shows the percentage of amount of all funds’ total expenditure by funds:
| Fund | Percentage of total expenditure |
| 050 - general fund | 25.5% |
| 980 - capital projects | 16.0% |
| 701 - metropolitan sewer district of greater Cincinnati | 12.7% |
| 704 - metropolitan sewer district capital improvements | 8.8% |
| 101 - water works | 7.9% |
| 711 - risk management | 4.9% |
| 759 - income tax - transit | 3.7% |
| 151 - bond retirement - city | 2.4% |
| 202 - fleet services | 1.7% |
| 898 - water works improvement 12 | 1.3% |
| 897 - water works improvement 11 | 1.3% |
| 302 - income tax - infrastructure | 1.1% |
| other (less than 1% each) | 12.9% |
| Total | 100.0% |
Software procedure:
Step-by-step software procedure to obtain bar chart for fund using Excel:
- In Excel sheet, enter Fund in one column and Percentage of total Expenditure in another column.
- Select the data, and then choose Insert > Insert Column Bar Charts.
- Select Clustered Column under More Column Charts.
Output using Excel is given below:
Interpretation:
- From the obtained table and bar chart, it can be observed that the fund category 050-General fund seems to be high, in terms of total expenditure percentage.
Want to see more full solutions like this?
Chapter 2 Solutions
Bundle: Modern Business Statistics with Microsoft Office Excel, Loose-Leaf Version, 6th + MindTap Business Statistics, 2 terms (12 months) Printed Access Card


- 59. At a certain gas station, 40% of the customers use regular gas (A1), 35% use plus gas (A2), and 25% use premium (A3). Of those customers using regular gas, only 30% fill their tanks (event B). Of those customers using plus, 60% fill their tanks, whereas of those using premium, 50% fill their tanks.a. What is the probability that the next customer will request plus gas and fill the tank (A2 B)?b. What is the probability that the next customer fills the tank?c. If the next customer fills the tank, what is the probability that regular gas is requested? Plus? Premium?arrow_forward38. Possible values of X, the number of components in a system submitted for repair that must be replaced, are 1, 2, 3, and 4 with corresponding probabilities .15, .35, .35, and .15, respectively. a. Calculate E(X) and then E(5 - X).b. Would the repair facility be better off charging a flat fee of $75 or else the amount $[150/(5 - X)]? [Note: It is not generally true that E(c/Y) = c/E(Y).]arrow_forward74. The proportions of blood phenotypes in the U.S. popula- tion are as follows:A B AB O .40 .11 .04 .45 Assuming that the phenotypes of two randomly selected individuals are independent of one another, what is the probability that both phenotypes are O? What is the probability that the phenotypes of two randomly selected individuals match?arrow_forward
- 53. A certain shop repairs both audio and video compo- nents. Let A denote the event that the next component brought in for repair is an audio component, and let B be the event that the next component is a compact disc player (so the event B is contained in A). Suppose that P(A) = .6 and P(B) = .05. What is P(BA)?arrow_forward26. A certain system can experience three different types of defects. Let A;(i = 1,2,3) denote the event that the sys- tem has a defect of type i. Suppose thatP(A1) = .12 P(A) = .07 P(A) = .05P(A, U A2) = .13P(A, U A3) = .14P(A2 U A3) = .10P(A, A2 A3) = .011Rshelfa. What is the probability that the system does not havea type 1 defect?b. What is the probability that the system has both type 1 and type 2 defects?c. What is the probability that the system has both type 1 and type 2 defects but not a type 3 defect? d. What is the probability that the system has at most two of these defects?arrow_forwardThe following are suggested designs for group sequential studies. Using PROCSEQDESIGN, provide the following for the design O’Brien Fleming and Pocock.• The critical boundary values for each analysis of the data• The expected sample sizes at each interim analysisAssume the standardized Z score method for calculating boundaries.Investigators are evaluating the success rate of a novel drug for treating a certain type ofbacterial wound infection. Since no existing treatment exists, they have planned a one-armstudy. They wish to test whether the success rate of the drug is better than 50%, whichthey have defined as the null success rate. Preliminary testing has estimated the successrate of the drug at 55%. The investigators are eager to get the drug into production andwould like to plan for 9 interim analyses (10 analyzes in total) of the data. Assume thesignificance level is 5% and power is 90%.Besides, draw a combined boundary plot (OBF, POC, and HP)arrow_forward
- Please provide the solution for the attached image in detailed.arrow_forward20 km, because GISS Worksheet 10 Jesse runs a small business selling and delivering mealie meal to the spaza shops. He charges a fixed rate of R80, 00 for delivery and then R15, 50 for each packet of mealle meal he delivers. The table below helps him to calculate what to charge his customers. 10 20 30 40 50 Packets of mealie meal (m) Total costs in Rands 80 235 390 545 700 855 (c) 10.1. Define the following terms: 10.1.1. Independent Variables 10.1.2. Dependent Variables 10.2. 10.3. 10.4. 10.5. Determine the independent and dependent variables. Are the variables in this scenario discrete or continuous values? Explain What shape do you expect the graph to be? Why? Draw a graph on the graph provided to represent the information in the table above. TOTAL COST OF PACKETS OF MEALIE MEAL 900 800 700 600 COST (R) 500 400 300 200 100 0 10 20 30 40 60 NUMBER OF PACKETS OF MEALIE MEALarrow_forwardLet X be a random variable with support SX = {−3, 0.5, 3, −2.5, 3.5}. Part ofits probability mass function (PMF) is given bypX(−3) = 0.15, pX(−2.5) = 0.3, pX(3) = 0.2, pX(3.5) = 0.15.(a) Find pX(0.5).(b) Find the cumulative distribution function (CDF), FX(x), of X.1(c) Sketch the graph of FX(x).arrow_forward
- A well-known company predominantly makes flat pack furniture for students. Variability with the automated machinery means the wood components are cut with a standard deviation in length of 0.45 mm. After they are cut the components are measured. If their length is more than 1.2 mm from the required length, the components are rejected. a) Calculate the percentage of components that get rejected. b) In a manufacturing run of 1000 units, how many are expected to be rejected? c) The company wishes to install more accurate equipment in order to reduce the rejection rate by one-half, using the same ±1.2mm rejection criterion. Calculate the maximum acceptable standard deviation of the new process.arrow_forward5. Let X and Y be independent random variables and let the superscripts denote symmetrization (recall Sect. 3.6). Show that (X + Y) X+ys.arrow_forward8. Suppose that the moments of the random variable X are constant, that is, suppose that EX" =c for all n ≥ 1, for some constant c. Find the distribution of X.arrow_forward
