Videos
Two inbred lines of sunflowers
a. Use the information above to determine
b. Determine

Trending nowThis is a popular solution!

Chapter 21 Solutions
Genetic Analysis: An Integrated Approach (2nd Edition)


- Compare the sample variances of P1 and P2. Account for any differences. Similarly, compare the sample variances of the F1 and F2 generations, and account for any differences. Give the possible causes of variation in each generation.arrow_forwardIn a wild strain of tomato plants, the phenotypic variance fortomato weight is 3.2 g2. In another strain of highly inbred tomatoesraised under the same environmental conditions, the phenotypicvariance is 2.2 g2. With regard to the wild strain,A. Estimate VG.B. What is hB2?C. Assuming that all of the genetic variance is additive, what is hN2?arrow_forwardExplain the possible reasons for the observed differences in the sample means. Account for the differences in the sample means of P1 and P2. Similarly, account for the differences in the sample means of the F1 and F2. Compare the difference in the parental generations with that in the filial generations.arrow_forward
- The mean, standard deviation, variances, and coefficient of variance of plant height from two rice plants (P1 and P2) and their progeny (F1 and F2) and a backcross generation (P1 x F1) are shown below. Explain the possible reasons for the observed differences in the sample means. Account for the differences in the sample means of P1 and P2. Similarly, account for the differences in the sample means of the F1 and F2. Compare the difference in the parental generations with that in the filial generations.arrow_forwardA wide-ranging survey of Nicotonia growing in its natural environment recorded a variation in corolla length ranging from 12mm to 47mm with a variance of 36.5. Subsequently, collected seeds were grown in a greenhouse and it was found that the range was now very much lower with most plants having similar corolla lengths and the variance was now only 8.4. What is the heritability of corolla length?arrow_forwardPlease solve this problem using the test cross branch diagram without a punnet square.arrow_forward
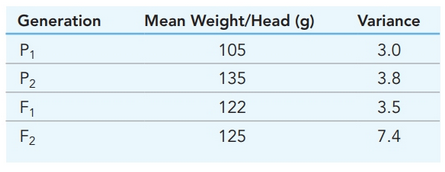
- Two inbred lines of sunflowers (P1 and P2) produce different total weights of seeds per flower head…. Show more Two inbred lines of sunflowers (P1 and P2) produce different total weights of seeds per flower head. The mean weight (in grams) and the variance of seed weights in different generations are listed in the table below. 1. Use the information to determine VG, VE and VP for this trait. 2. Determine H 2 for this trait. Generation Mean Weight/Head (g) Variance P1 105 3.0 P2 135 3.8 F1 122 3.5 F2 125 7.4 •arrow_forwardThe mean and standard deviation of plant height from two rice plants (P1 and P2) and their progeny (F1 and F2) and a backcross generation (P1 x F1) are shown below. Complete the table by calculating the variances and coefficient of variation for each population and answer the questionswhich follow (See image) 1. Explain the possible reasons for the observed differences in the sample means. Account forthe differences in the sample means of P1 and P2. Similarly, account for the differences in thesample means of the F1 and F2. Compare the difference in the parental generations with thatin the filial generations.2. Interpret the CV values from each population.3. Compare the sample variances of P1 and P2. Account for any differences. Similarly, comparethe sample variances of the F1 and F2 generations, and account for any differences. Give thepossible causes of variation in each generation.4. Calculate the broad-sense heritability of plant height in this species. Interpret your results.arrow_forwardImagine that you are performing a cross involving seed texture in garden pea plants. You cross true-breeding round and wrinkled parents to obtain F1 offspring. Which of the following experimental results in terms of numbers of plants are closest to what you expect in the F2 progeny? a. 8lOroundseeds b. 8lOwrinkledseeds c. 405:395 round seeds:wrinkled seeds d. 610:190 round seeds:wrinkled seedsarrow_forward
- Which of the following applies to the Hardy-Weinberg expression:p2 + 2pq + q2?a. Knowing either p2 or q2, you can calculate all the otherfrequencies.b. It applies to Mendelian traits that are controlled by one pairof alleles.c. 2pq = heterozygous individualsd. It can be used to determine the genotype and allelefrequencies of the previous and the next generations.e. All of these are correct.arrow_forwardThe mean and variance of plant height of two highly inbred strains (P1 and P2) and their progeny (F1 and F2) are shown here. Strain Mean (cm) Variance P1 34.2 4.2 P2 55.3 3.8 F1 44.2 5.6 F2 46.3 10.3 Calculate the broad-sense heritability (H2) of plant height in this species.arrow_forwardPlease refer to the table below. If only data on the variances for F1, F2 and BC1 populations were available, how will the broad sense heritability estimate change? Show solutions.arrow_forward
 Concepts of BiologyBiologyISBN:9781938168116Author:Samantha Fowler, Rebecca Roush, James WisePublisher:OpenStax College