
Concept explainers
Videos
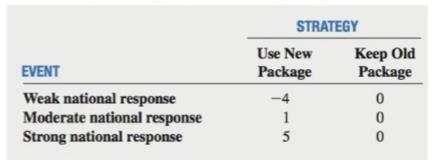
The manufacturer of a nationally distributed brand of potato chips wants to determine the feasibility of changing the product package from a cellophane bag to an unbreakable container. The product manager believes that there are three possible national market responses to a change in product package: weak. moderate. and strong. The projected payoffs, in millions of dollars, in increased or decreased pro�t compared to the current package are as follows:
Based on past experience. the product manager assigns the following probabilities to the different levels of national response:
P(Weak national response)
P(Moderate national response)
P(Strong national response)
a. Construct a decision tree,
b. Construct an opportunity loss table.
c. Compute the expected monetary value (EMV) for offering this new product package.
d. Compute the expected opportunity loss (EOL) for offering this new product package.
e. Explain the meaning of the
f. Compute the return-to-risk ratio (RTRR) for offering this new product package.
g. Based on the results of (c), (d), and (f), should the company offer this new product package? Why?
h. What are your answers to parts (c) through (g) if the probabilities are 0.6, 0.3, and 0.1, respectively?
i. What are you answer to parts (c) through (g) if the probabilities are 0.1, 0.3, and 0.6, respectively?
Before making a �nal decision, the product manager would like to test market the new package in a selected city by substituting the new package for the o1d package. A determination can then be made about whether sales have increased, decreased, or stayed the same. In previous test marketing of other products, when there was a subsequent weak national response, sales in the test city decreased
j. If sales in the test city stayed the same, revise the original probabilities in light of this new information.
k. Use the revised probabilities in (j) to repeat (c) through (g).
1. 1f sales in the test city decreased. revise the original probabilities in light of this new information.
m. In. Use the revised probabilities in (1) to repeat (0) through (g).
Want to see the full answer?
Check out a sample textbook solution
Chapter 20 Solutions
Student Solutions Manual for Basic Business Statistics
Additional Math Textbook Solutions
College Algebra (7th Edition)
Calculus for Business, Economics, Life Sciences, and Social Sciences (14th Edition)
Elementary Statistics ( 3rd International Edition ) Isbn:9781260092561
Elementary and Intermediate Algebra: Concepts and Applications (7th Edition)
Pathways To Math Literacy (looseleaf)
APPLIED STAT.IN BUS.+ECONOMICS


- 30. An individual who has automobile insurance from a certain company is randomly selected. Let Y be the num- ber of moving violations for which the individual was cited during the last 3 years. The pmf of Y isy | 1 2 4 8 16p(y) | .05 .10 .35 .40 .10 a.Compute E(Y).b. Suppose an individual with Y violations incurs a surcharge of $100Y^2. Calculate the expected amount of the surcharge.arrow_forward24. An insurance company offers its policyholders a num- ber of different premium payment options. For a ran- domly selected policyholder, let X = the number of months between successive payments. The cdf of X is as follows: F(x)=0.00 : x < 10.30 : 1≤x<30.40 : 3≤ x < 40.45 : 4≤ x <60.60 : 6≤ x < 121.00 : 12≤ x a. What is the pmf of X?b. Using just the cdf, compute P(3≤ X ≤6) and P(4≤ X).arrow_forward59. At a certain gas station, 40% of the customers use regular gas (A1), 35% use plus gas (A2), and 25% use premium (A3). Of those customers using regular gas, only 30% fill their tanks (event B). Of those customers using plus, 60% fill their tanks, whereas of those using premium, 50% fill their tanks.a. What is the probability that the next customer will request plus gas and fill the tank (A2 B)?b. What is the probability that the next customer fills the tank?c. If the next customer fills the tank, what is the probability that regular gas is requested? Plus? Premium?arrow_forward
- 38. Possible values of X, the number of components in a system submitted for repair that must be replaced, are 1, 2, 3, and 4 with corresponding probabilities .15, .35, .35, and .15, respectively. a. Calculate E(X) and then E(5 - X).b. Would the repair facility be better off charging a flat fee of $75 or else the amount $[150/(5 - X)]? [Note: It is not generally true that E(c/Y) = c/E(Y).]arrow_forward74. The proportions of blood phenotypes in the U.S. popula- tion are as follows:A B AB O .40 .11 .04 .45 Assuming that the phenotypes of two randomly selected individuals are independent of one another, what is the probability that both phenotypes are O? What is the probability that the phenotypes of two randomly selected individuals match?arrow_forward53. A certain shop repairs both audio and video compo- nents. Let A denote the event that the next component brought in for repair is an audio component, and let B be the event that the next component is a compact disc player (so the event B is contained in A). Suppose that P(A) = .6 and P(B) = .05. What is P(BA)?arrow_forward
- 26. A certain system can experience three different types of defects. Let A;(i = 1,2,3) denote the event that the sys- tem has a defect of type i. Suppose thatP(A1) = .12 P(A) = .07 P(A) = .05P(A, U A2) = .13P(A, U A3) = .14P(A2 U A3) = .10P(A, A2 A3) = .011Rshelfa. What is the probability that the system does not havea type 1 defect?b. What is the probability that the system has both type 1 and type 2 defects?c. What is the probability that the system has both type 1 and type 2 defects but not a type 3 defect? d. What is the probability that the system has at most two of these defects?arrow_forwardThe following are suggested designs for group sequential studies. Using PROCSEQDESIGN, provide the following for the design O’Brien Fleming and Pocock.• The critical boundary values for each analysis of the data• The expected sample sizes at each interim analysisAssume the standardized Z score method for calculating boundaries.Investigators are evaluating the success rate of a novel drug for treating a certain type ofbacterial wound infection. Since no existing treatment exists, they have planned a one-armstudy. They wish to test whether the success rate of the drug is better than 50%, whichthey have defined as the null success rate. Preliminary testing has estimated the successrate of the drug at 55%. The investigators are eager to get the drug into production andwould like to plan for 9 interim analyses (10 analyzes in total) of the data. Assume thesignificance level is 5% and power is 90%.Besides, draw a combined boundary plot (OBF, POC, and HP)arrow_forwardPlease provide the solution for the attached image in detailed.arrow_forward
 MATLAB: An Introduction with ApplicationsStatisticsISBN:9781119256830Author:Amos GilatPublisher:John Wiley & Sons Inc
 Probability and Statistics for Engineering and th...StatisticsISBN:9781305251809Author:Jay L. DevorePublisher:Cengage Learning
 Statistics for The Behavioral Sciences (MindTap C...StatisticsISBN:9781305504912Author:Frederick J Gravetter, Larry B. WallnauPublisher:Cengage Learning
 Elementary Statistics: Picturing the World (7th E...StatisticsISBN:9780134683416Author:Ron Larson, Betsy FarberPublisher:PEARSON
 The Basic Practice of StatisticsStatisticsISBN:9781319042578Author:David S. Moore, William I. Notz, Michael A. FlignerPublisher:W. H. Freeman
 Introduction to the Practice of StatisticsStatisticsISBN:9781319013387Author:David S. Moore, George P. McCabe, Bruce A. CraigPublisher:W. H. Freeman