
Videos
For this problem, use the following payoff table:

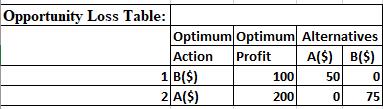
a. Construct an opportunity loss table.
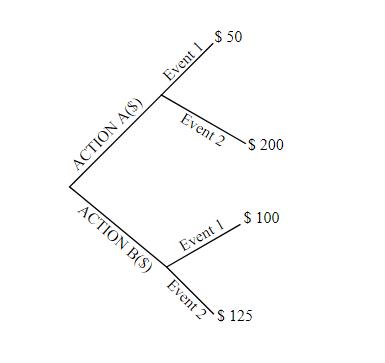
b. Construct a decision tree.
a.
Make an opportunity table using the given payoff table.
Explanation of Solution
The payoff table is given.
Use Excel to construct an opportunity loss table.
Software procedure:
The step-by-step procedure to make an opportunity loss table is given below.
Select Add-Ins > PHStat > Decision-Making > Opportunity Loss.
In the opportunity loss dialog, fill Number of Events as 2 and Number of Alternative Actions as 2.
Click OK.
In the template generated by Excel, fill the payoff table as given in the problem.
The excel output for opportunity loss table is shown below.
b.
Construct a decision tree for the given payoff table.
Explanation of Solution
The tree diagram for the given payoff table is given below.
Want to see more full solutions like this?
Chapter 20 Solutions
Student Solutions Manual for Basic Business Statistics


- 9. The concentration function of a random variable X is defined as Qx(h) = sup P(x ≤ X ≤x+h), h>0. Show that, if X and Y are independent random variables, then Qx+y (h) min{Qx(h). Qr (h)).arrow_forward10. Prove that, if (t)=1+0(12) as asf->> O is a characteristic function, then p = 1.arrow_forward9. The concentration function of a random variable X is defined as Qx(h) sup P(x ≤x≤x+h), h>0. (b) Is it true that Qx(ah) =aQx (h)?arrow_forward
- 3. Let X1, X2,..., X, be independent, Exp(1)-distributed random variables, and set V₁₁ = max Xk and W₁ = X₁+x+x+ Isk≤narrow_forward7. Consider the function (t)=(1+|t|)e, ER. (a) Prove that is a characteristic function. (b) Prove that the corresponding distribution is absolutely continuous. (c) Prove, departing from itself, that the distribution has finite mean and variance. (d) Prove, without computation, that the mean equals 0. (e) Compute the density.arrow_forward1. Show, by using characteristic, or moment generating functions, that if fx(x) = ½ex, -∞0 < x < ∞, then XY₁ - Y2, where Y₁ and Y2 are independent, exponentially distributed random variables.arrow_forward
- 1. Show, by using characteristic, or moment generating functions, that if 1 fx(x): x) = ½exarrow_forward1990) 02-02 50% mesob berceus +7 What's the probability of getting more than 1 head on 10 flips of a fair coin?arrow_forward9. The concentration function of a random variable X is defined as Qx(h) sup P(x≤x≤x+h), h>0. = x (a) Show that Qx+b(h) = Qx(h).arrow_forward
- Suppose that you buy a lottery ticket, and you have to pick six numbers from 1 through 50 (repetitions allowed). Which combination is more likely to win: 13, 48, 17, 22, 6, 39 or 1, 2, 3, 4, 5, 6? barrow_forward2 Make a histogram from this data set of test scores: 72, 79, 81, 80, 63, 62, 89, 99, 50, 78, 87, 97, 55, 69, 97, 87, 88, 99, 76, 78, 65, 77, 88, 90, and 81. Would a pie chart be appropriate for this data? ganizing Quantitative Data: Charts and Graphs 45arrow_forward10 Meteorologists use computer models to predict when and where a hurricane will hit shore. Suppose they predict that hurricane Stat has a 20 percent chance of hitting the East Coast. a. On what info are the meteorologists basing this prediction? b. Why is this prediction harder to make than your chance of getting a head on your next coin toss? U anoiaarrow_forward
 Glencoe Algebra 1, Student Edition, 9780079039897...AlgebraISBN:9780079039897Author:CarterPublisher:McGraw Hill