
Intro Stats, Books a la carte Plus NEW MyLab Statistics with Pearson eText -- Access Card Package (5th Edition)
5th Edition
ISBN: 9780134210247
Author: Richard D. De Veaux, Paul Velleman, David E. Bock
Publisher: PEARSON
expand_more
expand_more
format_list_bulleted
Concept explainers
Videos
Textbook Question
Chapter 2, Problem 4E
Movie ratings The Motion Picture Association of America (MPAA) rates each film to designate the appropriate audience. The ratings are G, PG, PG-13, and R. The pie chart shows the MPAA ratings of the same 891 movies released in 2014 and 2015 as in Exercise 3.
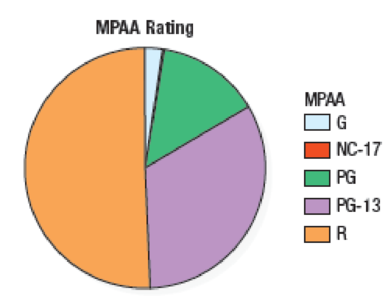
- a) Is this an appropriate display for the ratings? Why or why not?
- b) Which was the most common rating?
Expert Solution & Answer
Want to see the full answer?
Check out a sample textbook solution
Students have asked these similar questions
Question 2
A nickel-titanium alloy is used to make components for jet turbine aircraft engines. Cracking is a potentially
serious problem in the final part because it can lead to nonrecoverable failure. A test is run at the parts producer
to determine the effect of four factors on cracks. The four factors are: pouring temperature (A), titanium content
(B), heat treatment method (C), amount of grain refiner used (D). Two replicates of a 24 design are run, and
the length of crack (in mm x10-2) induced in a sample coupon subjected to a standard test is measured. The
data are shown in Table 2.
1
(a) Estimate the factor effects. Which factor effects appear to be large?
(b) Conduct an analysis of variance. Do any of the factors affect cracking? Use a = 0.05.
(c) Write down a regression model that can be used to predict crack length as a function of the significant
main effects and interactions you have identified in part (b).
(d) Analyze the residuals from this experiment.
(e) Is there an…
A 24-1 design has been used to investigate the effect of four factors on the resistivity of a silicon wafer. The data
from this experiment are shown in Table 4.
Table 4: Resistivity Experiment for Exercise 5
Run
A
B
с
D
Resistivity
1
23
2
3
4
5
6
7
8
9
10
11
12
I+I+I+I+Oooo
0
0
||++TI++o000
33.2
4.6
31.2
9.6
40.6
162.4
39.4
158.6
63.4
62.6
58.7
0
0
60.9
3
(a) Estimate the factor effects. Plot the effect estimates on a normal probability scale.
(b) Identify a tentative model for this process. Fit the model and test for curvature.
(c) Plot the residuals from the model in part (b) versus the predicted resistivity. Is there any indication on
this plot of model inadequacy?
(d) Construct a normal probability plot of the residuals. Is there any reason to doubt the validity of the
normality assumption?
Stem1: 1,4
Stem 2: 2,4,8
Stem3: 2,4
Stem4: 0,1,6,8
Stem5: 0,1,2,3,9
Stem 6: 2,2
What’s the Min,Q1, Med,Q3,Max?
Chapter 2 Solutions
Intro Stats, Books a la carte Plus NEW MyLab Statistics with Pearson eText -- Access Card Package (5th Edition)
Ch. 2.3 - You may be surprised to find that you already have...Ch. 2.3 - You may be surprised to find that you already have...Ch. 2.3 - You may be surprised to find that you already have...Ch. 2.3 - Prob. 4JCCh. 2.3 - Prob. 5JCCh. 2.5 - The U.S. Census Bureau reports the median family...Ch. 2.5 - Prob. 7JCCh. 2.5 - Prob. 8JCCh. 2 - SECTION 2.1 1. Automobile fatalities The table...Ch. 2 - Nonoccupant fatalities The frequencies of traffic...
Ch. 2 - Prob. 3ECh. 2 - Movie ratings The Motion Picture Association of...Ch. 2 - Prob. 5ECh. 2 - Marriage in decline Changing attitudes about...Ch. 2 - Traffic fatalities 2013 Here are two histograms...Ch. 2 - Prob. 8ECh. 2 - Prob. 9ECh. 2 - Prob. 10ECh. 2 - E-mails A university teacher saved every e-mail...Ch. 2 - Adoptions The U.S. Census Bureau keeps track of...Ch. 2 - Biceps revisited Describe the shape of the...Ch. 2 - E-mails II For the distribution of e-mails sent by...Ch. 2 - Life expectancy Here are the life expectancies at...Ch. 2 - Prob. 16ECh. 2 - Life expectancy II For the 146 life expectancies...Ch. 2 - Adoptions II For the number of adoptions in...Ch. 2 - How big is your bicep II? For the bicep...Ch. 2 - Shoe sizes II For the shoe sizes in Exercise 16,...Ch. 2 - SECTION 2.5 21. Life expectancy III For the 190...Ch. 2 - Prob. 22ECh. 2 - How big is your bicep III? For the bicep...Ch. 2 - Prob. 24ECh. 2 - Thinking about shape Would you expect...Ch. 2 - More shapes Would you expect distributions of...Ch. 2 - Movie genres again Here is a bar chart summarizing...Ch. 2 - Prob. 36ECh. 2 - Prob. 37ECh. 2 - Prob. 38ECh. 2 - Prob. 39ECh. 2 - Prob. 40ECh. 2 - Prob. 41ECh. 2 - Prob. 42ECh. 2 - Prob. 43ECh. 2 - Modalities A survey of athletic trainers asked...Ch. 2 - Cereals The histogram shows the carbohydrate...Ch. 2 - Run times One of the authors collected the times...Ch. 2 - Heart attack stays The histogram shows the lengths...Ch. 2 - Bird species 2013 The Cornell Lab of Ornithology...Ch. 2 - Super Bowl points 2016 How many points do football...Ch. 2 - Prob. 50ECh. 2 - Test scores, large class Test scores from a large...Ch. 2 - Prob. 52ECh. 2 - Mistake A clerk entering salary data into a...Ch. 2 - Sick days During contract negotiations, a company...Ch. 2 - Prob. 55ECh. 2 - Tornadoes 2015 Here are the annual numbers of...Ch. 2 - Prob. 57ECh. 2 - Tornadoes 2015 II Using the data from Exercise 56,...Ch. 2 - Pizza prices The histogram shows the distribution...Ch. 2 - Neck size The histogram shows the neck sizes (in...Ch. 2 - Pizza prices again Look again at the histogram of...Ch. 2 - Neck sizes again Look again at the histogram of...Ch. 2 - Movie lengths 2010 The histogram shows the running...Ch. 2 - Golf drives 2015 The display shows the average...Ch. 2 - Prob. 65ECh. 2 - Golf drives II 2015 Exercise 64 looked at...Ch. 2 - Prob. 67ECh. 2 - Cold weather A meteorologist preparing a talk...Ch. 2 - Gasoline 2014 In January 2014, 16 gas stations in...Ch. 2 - The great one During his 20 seasons in the NHL,...Ch. 2 - Prob. 71ECh. 2 - Prob. 72ECh. 2 - Prob. 73ECh. 2 - Prob. 74ECh. 2 - Prob. 75ECh. 2 - Prob. 76ECh. 2 - Acid rain Two researchers measured the pH (a scale...Ch. 2 - Marijuana 2015 In 2015 the Council of Europe...Ch. 2 - Prob. 79ECh. 2 - Prob. 80ECh. 2 - Prob. 81ECh. 2 - ZIP codes revisited Here are some summary...Ch. 2 - Prob. 83ECh. 2 - Prob. 84ECh. 2 - Prob. 85E
Knowledge Booster


Learn more about
Need a deep-dive on the concept behind this application? Look no further. Learn more about this topic, statistics and related others by exploring similar questions and additional content below.Similar questions
- Are the t-statistics here greater than 1.96? What do you conclude? colgPA= 1.39+0.412 hsGPA (.33) (0.094) Find the P valuearrow_forwardA poll before the elections showed that in a given sample 79% of people vote for candidate C. How many people should be interviewed so that the pollsters can be 99% sure that from 75% to 83% of the population will vote for candidate C? Round your answer to the whole number.arrow_forwardSuppose a random sample of 459 married couples found that 307 had two or more personality preferences in common. In another random sample of 471 married couples, it was found that only 31 had no preferences in common. Let p1 be the population proportion of all married couples who have two or more personality preferences in common. Let p2 be the population proportion of all married couples who have no personality preferences in common. Find a95% confidence interval for . Round your answer to three decimal places.arrow_forward
- A history teacher interviewed a random sample of 80 students about their preferences in learning activities outside of school and whether they are considering watching a historical movie at the cinema. 69 answered that they would like to go to the cinema. Let p represent the proportion of students who want to watch a historical movie. Determine the maximal margin of error. Use α = 0.05. Round your answer to three decimal places. arrow_forwardA random sample of medical files is used to estimate the proportion p of all people who have blood type B. If you have no preliminary estimate for p, how many medical files should you include in a random sample in order to be 99% sure that the point estimate will be within a distance of 0.07 from p? Round your answer to the next higher whole number.arrow_forwardA clinical study is designed to assess the average length of hospital stay of patients who underwent surgery. A preliminary study of a random sample of 70 surgery patients’ records showed that the standard deviation of the lengths of stay of all surgery patients is 7.5 days. How large should a sample to estimate the desired mean to within 1 day at 95% confidence? Round your answer to the whole number.arrow_forward
- A clinical study is designed to assess the average length of hospital stay of patients who underwent surgery. A preliminary study of a random sample of 70 surgery patients’ records showed that the standard deviation of the lengths of stay of all surgery patients is 7.5 days. How large should a sample to estimate the desired mean to within 1 day at 95% confidence? Round your answer to the whole number.arrow_forwardIn the experiment a sample of subjects is drawn of people who have an elbow surgery. Each of the people included in the sample was interviewed about their health status and measurements were taken before and after surgery. Are the measurements before and after the operation independent or dependent samples?arrow_forwardiid 1. The CLT provides an approximate sampling distribution for the arithmetic average Ỹ of a random sample Y₁, . . ., Yn f(y). The parameters of the approximate sampling distribution depend on the mean and variance of the underlying random variables (i.e., the population mean and variance). The approximation can be written to emphasize this, using the expec- tation and variance of one of the random variables in the sample instead of the parameters μ, 02: YNEY, · (1 (EY,, varyi n For the following population distributions f, write the approximate distribution of the sample mean. (a) Exponential with rate ẞ: f(y) = ß exp{−ßy} 1 (b) Chi-square with degrees of freedom: f(y) = ( 4 ) 2 y = exp { — ½/ } г( (c) Poisson with rate λ: P(Y = y) = exp(-\} > y! y²arrow_forward
- 2. Let Y₁,……., Y be a random sample with common mean μ and common variance σ². Use the CLT to write an expression approximating the CDF P(Ỹ ≤ x) in terms of µ, σ² and n, and the standard normal CDF Fz(·).arrow_forwardmatharrow_forwardCompute the median of the following data. 32, 41, 36, 42, 29, 30, 40, 22, 25, 37arrow_forward
arrow_back_ios
SEE MORE QUESTIONS
arrow_forward_ios
Recommended textbooks for you
 Glencoe Algebra 1, Student Edition, 9780079039897...AlgebraISBN:9780079039897Author:CarterPublisher:McGraw Hill
 Holt Mcdougal Larson Pre-algebra: Student Edition...AlgebraISBN:9780547587776Author:HOLT MCDOUGALPublisher:HOLT MCDOUGAL
 Functions and Change: A Modeling Approach to Coll...AlgebraISBN:9781337111348Author:Bruce Crauder, Benny Evans, Alan NoellPublisher:Cengage Learning
 Elementary Geometry For College Students, 7eGeometryISBN:9781337614085Author:Alexander, Daniel C.; Koeberlein, Geralyn M.Publisher:Cengage,
 College Algebra (MindTap Course List)AlgebraISBN:9781305652231Author:R. David Gustafson, Jeff HughesPublisher:Cengage Learning
 Algebra: Structure And Method, Book 1AlgebraISBN:9780395977224Author:Richard G. Brown, Mary P. Dolciani, Robert H. Sorgenfrey, William L. ColePublisher:McDougal Littell
Glencoe Algebra 1, Student Edition, 9780079039897...
Algebra
ISBN:9780079039897
Author:Carter
Publisher:McGraw Hill
Holt Mcdougal Larson Pre-algebra: Student Edition...
Algebra
ISBN:9780547587776
Author:HOLT MCDOUGAL
Publisher:HOLT MCDOUGAL
Functions and Change: A Modeling Approach to Coll...
Algebra
ISBN:9781337111348
Author:Bruce Crauder, Benny Evans, Alan Noell
Publisher:Cengage Learning
Elementary Geometry For College Students, 7e
Geometry
ISBN:9781337614085
Author:Alexander, Daniel C.; Koeberlein, Geralyn M.
Publisher:Cengage,
College Algebra (MindTap Course List)
Algebra
ISBN:9781305652231
Author:R. David Gustafson, Jeff Hughes
Publisher:Cengage Learning
Algebra: Structure And Method, Book 1
Algebra
ISBN:9780395977224
Author:Richard G. Brown, Mary P. Dolciani, Robert H. Sorgenfrey, William L. Cole
Publisher:McDougal Littell
Probability & Statistics (28 of 62) Basic Definitions and Symbols Summarized; Author: Michel van Biezen;https://www.youtube.com/watch?v=21V9WBJLAL8;License: Standard YouTube License, CC-BY
Introduction to Probability, Basic Overview - Sample Space, & Tree Diagrams; Author: The Organic Chemistry Tutor;https://www.youtube.com/watch?v=SkidyDQuupA;License: Standard YouTube License, CC-BY