
Intro Stats, Books a la carte Plus NEW MyLab Statistics with Pearson eText -- Access Card Package (5th Edition)
5th Edition
ISBN: 9780134210247
Author: Richard D. De Veaux, Paul Velleman, David E. Bock
Publisher: PEARSON
expand_more
expand_more
format_list_bulleted
Videos
Textbook Question
Chapter 2, Problem 2E
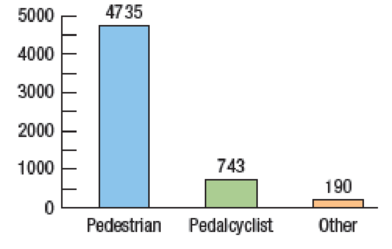
Nonoccupant fatalities The frequencies of traffic fatalities of nonoccupants of vehicles are shown in the following bar chart. (www.the-numbers.com/research-analysis) Change this to a bar chart of relative frequencies.
Nonoccupant Fatalities
Expert Solution & Answer
Want to see the full answer?
Check out a sample textbook solution
Students have asked these similar questions
Homework Let X1, X2, Xn be a random sample from f(x;0) where
f(x; 0) = (-), 0 < x < ∞,0 € R
Using Basu's theorem, show that Y = min{X} and Z =Σ(XY) are indep.
-
Homework Let X1, X2, Xn be a random sample from f(x; 0) where
f(x; 0) = e−(2-0), 0 < x < ∞,0 € R
Using Basu's theorem, show that Y = min{X} and Z =Σ(XY) are indep.
An Arts group holds a raffle. Each raffle ticket costs $2 and the raffle consists of 2500 tickets. The prize is a vacation worth $3,000.
a. Determine your expected value if you buy one ticket.
b. Determine your expected value if you buy five tickets.
How much will the Arts group gain or lose if they sell all the tickets?
Chapter 2 Solutions
Intro Stats, Books a la carte Plus NEW MyLab Statistics with Pearson eText -- Access Card Package (5th Edition)
Ch. 2.3 - You may be surprised to find that you already have...Ch. 2.3 - You may be surprised to find that you already have...Ch. 2.3 - You may be surprised to find that you already have...Ch. 2.3 - Prob. 4JCCh. 2.3 - Prob. 5JCCh. 2.5 - The U.S. Census Bureau reports the median family...Ch. 2.5 - Prob. 7JCCh. 2.5 - Prob. 8JCCh. 2 - SECTION 2.1 1. Automobile fatalities The table...Ch. 2 - Nonoccupant fatalities The frequencies of traffic...
Ch. 2 - Prob. 3ECh. 2 - Movie ratings The Motion Picture Association of...Ch. 2 - Prob. 5ECh. 2 - Marriage in decline Changing attitudes about...Ch. 2 - Traffic fatalities 2013 Here are two histograms...Ch. 2 - Prob. 8ECh. 2 - Prob. 9ECh. 2 - Prob. 10ECh. 2 - E-mails A university teacher saved every e-mail...Ch. 2 - Adoptions The U.S. Census Bureau keeps track of...Ch. 2 - Biceps revisited Describe the shape of the...Ch. 2 - E-mails II For the distribution of e-mails sent by...Ch. 2 - Life expectancy Here are the life expectancies at...Ch. 2 - Prob. 16ECh. 2 - Life expectancy II For the 146 life expectancies...Ch. 2 - Adoptions II For the number of adoptions in...Ch. 2 - How big is your bicep II? For the bicep...Ch. 2 - Shoe sizes II For the shoe sizes in Exercise 16,...Ch. 2 - SECTION 2.5 21. Life expectancy III For the 190...Ch. 2 - Prob. 22ECh. 2 - How big is your bicep III? For the bicep...Ch. 2 - Prob. 24ECh. 2 - Thinking about shape Would you expect...Ch. 2 - More shapes Would you expect distributions of...Ch. 2 - Movie genres again Here is a bar chart summarizing...Ch. 2 - Prob. 36ECh. 2 - Prob. 37ECh. 2 - Prob. 38ECh. 2 - Prob. 39ECh. 2 - Prob. 40ECh. 2 - Prob. 41ECh. 2 - Prob. 42ECh. 2 - Prob. 43ECh. 2 - Modalities A survey of athletic trainers asked...Ch. 2 - Cereals The histogram shows the carbohydrate...Ch. 2 - Run times One of the authors collected the times...Ch. 2 - Heart attack stays The histogram shows the lengths...Ch. 2 - Bird species 2013 The Cornell Lab of Ornithology...Ch. 2 - Super Bowl points 2016 How many points do football...Ch. 2 - Prob. 50ECh. 2 - Test scores, large class Test scores from a large...Ch. 2 - Prob. 52ECh. 2 - Mistake A clerk entering salary data into a...Ch. 2 - Sick days During contract negotiations, a company...Ch. 2 - Prob. 55ECh. 2 - Tornadoes 2015 Here are the annual numbers of...Ch. 2 - Prob. 57ECh. 2 - Tornadoes 2015 II Using the data from Exercise 56,...Ch. 2 - Pizza prices The histogram shows the distribution...Ch. 2 - Neck size The histogram shows the neck sizes (in...Ch. 2 - Pizza prices again Look again at the histogram of...Ch. 2 - Neck sizes again Look again at the histogram of...Ch. 2 - Movie lengths 2010 The histogram shows the running...Ch. 2 - Golf drives 2015 The display shows the average...Ch. 2 - Prob. 65ECh. 2 - Golf drives II 2015 Exercise 64 looked at...Ch. 2 - Prob. 67ECh. 2 - Cold weather A meteorologist preparing a talk...Ch. 2 - Gasoline 2014 In January 2014, 16 gas stations in...Ch. 2 - The great one During his 20 seasons in the NHL,...Ch. 2 - Prob. 71ECh. 2 - Prob. 72ECh. 2 - Prob. 73ECh. 2 - Prob. 74ECh. 2 - Prob. 75ECh. 2 - Prob. 76ECh. 2 - Acid rain Two researchers measured the pH (a scale...Ch. 2 - Marijuana 2015 In 2015 the Council of Europe...Ch. 2 - Prob. 79ECh. 2 - Prob. 80ECh. 2 - Prob. 81ECh. 2 - ZIP codes revisited Here are some summary...Ch. 2 - Prob. 83ECh. 2 - Prob. 84ECh. 2 - Prob. 85E
Knowledge Booster


Learn more about
Need a deep-dive on the concept behind this application? Look no further. Learn more about this topic, statistics and related others by exploring similar questions and additional content below.Similar questions
- Please show as much work as possible to clearly show the steps you used to find each solution. If you plan to use a calculator, please be sure to clearly indicate your strategy. Consider the following game. It costs $3 each time you roll a six-sided number cube. If you roll a 6 you win $15. If you roll any other number, you receive nothing. a) Find the expected value of the game. b) If you play this game many times, will you expect to gain or lose money?arrow_forward= 12:02 WeBWorK / 2024 Fall Rafeek MTH23 D02 / 9.2 Testing the Mean mu / 3 38 WEBWORK Previous Problem Problem List Next Problem 9.2 Testing the Mean mu: Problem 3 (1 point) Test the claim that the population of sophomore college students has a mean grade point average greater than 2.2. Sample statistics include n = 71, x = 2.44, and s = 0.9. Use a significance level of a = 0.01. The test statistic is The P-Value is between : The final conclusion is < P-value < A. There is sufficient evidence to support the claim that the mean grade point average is greater than 2.2. ○ B. There is not sufficient evidence to support the claim that the mean grade point average is greater than 2.2. Note: You can earn partial credit on this problem. Note: You are in the Reduced Scoring Period. All work counts for 50% of the original. Preview My Answers Submit Answers You have attempted this problem 0 times. You have unlimited attempts remaining. . Oli wwm01.bcc.cuny.eduarrow_forwardThere are four white, fourteen blue and five green marbles in a bag. A marble is selected from the bag without looking. Find the odds of the following: The odds against selecting a green marble. The odds in favour of not selecting a green marble The odds in favor of the marble selected being either a white or a blue marble. What is true about the above odds? Explainarrow_forward
- Please show as much work as possible to clearly show the steps you used to find each solution. If you plan to use a calculator, please be sure to clearly indicate your strategy. 1. The probability of a soccer game in a particular league going into overtime is 0.125. Find the following: a. The odds in favour of a game going into overtime. b. The odds in favour of a game not going into overtime. c. If the teams in the league play 100 games in a season, about how many games would you expect to go into overtime?arrow_forwardexplain the importance of the Hypothesis test in a business setting, and give an example of a situation where it is helpful in business decision making.arrow_forwardA college wants to estimate what students typically spend on textbooks. A report fromthe college bookstore observes that textbooks range in price from $22 to $186. Toobtain a 95% confidence level for a confidence interval estimate to plus or minus $10,how many students should the college survey? (We may estimate the populationstandard deviation as (range) ÷ 4.)arrow_forward
- In a study of how students give directions, forty volunteers were given the task ofexplaining to another person how to reach a destination. Researchers measured thefollowing five aspects of the subjects’ direction-giving behavior:• whether a map was available or if directions were given from memory without a map,• the gender of the direction-giver,• the distances given as part of the directions,• the number of times directions such as “north” or “left” were used,• the frequency of errors in directions. Identify each of the variables in this study, and whether each is quantitative orqualitative. For each quantitative variable, state whether it is discrete or continuous. Was this an observational study or an experimental study? Explain your answer.arrow_forwardexplain the difference between the confident interval and the confident level. provide an example to show how to correctly interpret a confidence interval.arrow_forwardSketch to scale the orbit of Earth about the sun. Graph Icarus’ orbit on the same set of axesWhile the sun is the center of Earth’s orbit, it is a focus of Icarus’ orbit. There aretwo points of intersection on the graph. Based on the graph, what is the approximate distance between the two points of intersection (in AU)?arrow_forward
- The diameters of ball bearings are distributed normally. The mean diameter is 67 millimeters and the standard deviation is 3 millimeters. Find the probability that the diameter of a selected bearing is greater than 63 millimeters. Round to four decimal places.arrow_forwardSuppose you like to keep a jar of change on your desk. Currently, the jar contains the following: 22 Pennies 27 Dimes 9 Nickels 30 Quarters What is the probability that you reach into the jar and randomly grab a penny and then, without replacement, a dime? Express as a fraction or a decimal number rounded to four decimal places.arrow_forwardA box contains 14 large marbles and 10 small marbles. Each marble is either green or white. 9 of the large marbles are green, and 4 of the small marbles are white. If a marble is randomly selected from the box, what is the probability that it is small or white? Express as a fraction or a decimal number rounded to four decimal places.arrow_forward
arrow_back_ios
SEE MORE QUESTIONS
arrow_forward_ios
Recommended textbooks for you
 Glencoe Algebra 1, Student Edition, 9780079039897...AlgebraISBN:9780079039897Author:CarterPublisher:McGraw Hill
 Big Ideas Math A Bridge To Success Algebra 1: Stu...AlgebraISBN:9781680331141Author:HOUGHTON MIFFLIN HARCOURTPublisher:Houghton Mifflin Harcourt
 Holt Mcdougal Larson Pre-algebra: Student Edition...AlgebraISBN:9780547587776Author:HOLT MCDOUGALPublisher:HOLT MCDOUGAL
 Elementary Geometry For College Students, 7eGeometryISBN:9781337614085Author:Alexander, Daniel C.; Koeberlein, Geralyn M.Publisher:Cengage,
 Algebra: Structure And Method, Book 1AlgebraISBN:9780395977224Author:Richard G. Brown, Mary P. Dolciani, Robert H. Sorgenfrey, William L. ColePublisher:McDougal Littell
Glencoe Algebra 1, Student Edition, 9780079039897...
Algebra
ISBN:9780079039897
Author:Carter
Publisher:McGraw Hill
Big Ideas Math A Bridge To Success Algebra 1: Stu...
Algebra
ISBN:9781680331141
Author:HOUGHTON MIFFLIN HARCOURT
Publisher:Houghton Mifflin Harcourt
Holt Mcdougal Larson Pre-algebra: Student Edition...
Algebra
ISBN:9780547587776
Author:HOLT MCDOUGAL
Publisher:HOLT MCDOUGAL
Elementary Geometry For College Students, 7e
Geometry
ISBN:9781337614085
Author:Alexander, Daniel C.; Koeberlein, Geralyn M.
Publisher:Cengage,
Algebra: Structure And Method, Book 1
Algebra
ISBN:9780395977224
Author:Richard G. Brown, Mary P. Dolciani, Robert H. Sorgenfrey, William L. Cole
Publisher:McDougal Littell
How to make Frequency Distribution Table / Tally Marks and Frequency Distribution Table; Author: Reenu Math;https://www.youtube.com/watch?v=i_A6RiE8tLE;License: Standard YouTube License, CC-BY
Frequency distribution table in statistics; Author: Math and Science;https://www.youtube.com/watch?v=T7KYO76DoOE;License: Standard YouTube License, CC-BY
Frequency Distribution Table for Grouped/Continuous data | Math Dot Com; Author: Maths dotcom;https://www.youtube.com/watch?v=ErnccbXQOPY;License: Standard Youtube License