
Intro Stats, Books a la carte Plus NEW MyLab Statistics with Pearson eText -- Access Card Package (5th Edition)
5th Edition
ISBN: 9780134210247
Author: Richard D. De Veaux, Paul Velleman, David E. Bock
Publisher: PEARSON
expand_more
expand_more
format_list_bulleted
Concept explainers
Videos
Textbook Question
Chapter 2, Problem 19E
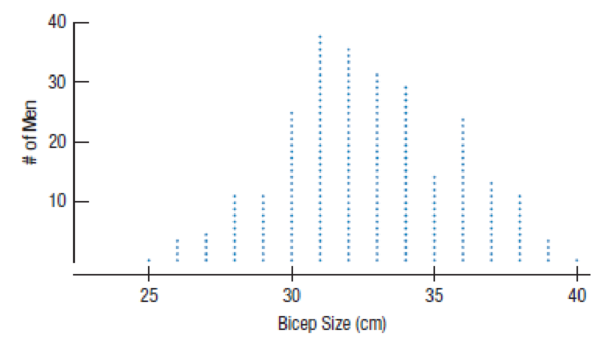
How big is your bicep II? For the bicep measurements in Exercise 10, would you report the
10. How big is your bicep in cm? The study in Exercise 9 actually measured the bicep circumference in centimeters. The dot plot in Exercise 9 was formed by dividing each measurement by 2.54 to convert it to inches. Here is the dot plot of the original values in cm. Do the two dot plots look different? What might account for that?
Expert Solution & Answer
Want to see the full answer?
Check out a sample textbook solution
Students have asked these similar questions
21. ANALYSIS OF LAST DIGITS Heights of statistics students were obtained by the author as
part of an experiment conducted for class. The last digits of those heights are listed below.
Construct a frequency distribution with 10 classes. Based on the distribution, do the
heights appear to be reported or actually measured? Does there appear to be a gap in the
frequencies and, if so, how might that gap be explained? What do you know about the
accuracy of the results?
3 4
555
0 0 0 0 0 0 0 0 0 1 1 23 3
5 5 5 5 5 5 5 5 5 5 5 5 6 6 8 8 8 9
A side view of a recycling bin lid is diagramed below where two panels come together at a right angle.
45 in
24 in
Width? —
Given this information, how wide is the recycling bin in inches?
1 No.
2
3
4
Binomial Prob.
X
n
P
Answer
5
6 4
7
8
9
10
12345678
8
3
4
2
2552
10
0.7
0.233
0.3
0.132
7
0.6
0.290
20
0.02
0.053
150
1000
0.15
0.035
8
7
10
0.7
0.383
11
9
3
5
0.3
0.132
12
10
4
7
0.6
0.290
13
Poisson Probability
14
X
lambda
Answer
18 4
19
20
21
22
23 9
15
16
17 3
1234567829
3
2
0.180
2
1.5
0.251
12
10
0.095
5
3
0.101
7
4
0.060
3
2
0.180
2
1.5
0.251
24 10
12
10
0.095
Chapter 2 Solutions
Intro Stats, Books a la carte Plus NEW MyLab Statistics with Pearson eText -- Access Card Package (5th Edition)
Ch. 2.3 - You may be surprised to find that you already have...Ch. 2.3 - You may be surprised to find that you already have...Ch. 2.3 - You may be surprised to find that you already have...Ch. 2.3 - Prob. 4JCCh. 2.3 - Prob. 5JCCh. 2.5 - The U.S. Census Bureau reports the median family...Ch. 2.5 - Prob. 7JCCh. 2.5 - Prob. 8JCCh. 2 - SECTION 2.1 1. Automobile fatalities The table...Ch. 2 - Nonoccupant fatalities The frequencies of traffic...
Ch. 2 - Prob. 3ECh. 2 - Movie ratings The Motion Picture Association of...Ch. 2 - Prob. 5ECh. 2 - Marriage in decline Changing attitudes about...Ch. 2 - Traffic fatalities 2013 Here are two histograms...Ch. 2 - Prob. 8ECh. 2 - Prob. 9ECh. 2 - Prob. 10ECh. 2 - E-mails A university teacher saved every e-mail...Ch. 2 - Adoptions The U.S. Census Bureau keeps track of...Ch. 2 - Biceps revisited Describe the shape of the...Ch. 2 - E-mails II For the distribution of e-mails sent by...Ch. 2 - Life expectancy Here are the life expectancies at...Ch. 2 - Prob. 16ECh. 2 - Life expectancy II For the 146 life expectancies...Ch. 2 - Adoptions II For the number of adoptions in...Ch. 2 - How big is your bicep II? For the bicep...Ch. 2 - Shoe sizes II For the shoe sizes in Exercise 16,...Ch. 2 - SECTION 2.5 21. Life expectancy III For the 190...Ch. 2 - Prob. 22ECh. 2 - How big is your bicep III? For the bicep...Ch. 2 - Prob. 24ECh. 2 - Thinking about shape Would you expect...Ch. 2 - More shapes Would you expect distributions of...Ch. 2 - Movie genres again Here is a bar chart summarizing...Ch. 2 - Prob. 36ECh. 2 - Prob. 37ECh. 2 - Prob. 38ECh. 2 - Prob. 39ECh. 2 - Prob. 40ECh. 2 - Prob. 41ECh. 2 - Prob. 42ECh. 2 - Prob. 43ECh. 2 - Modalities A survey of athletic trainers asked...Ch. 2 - Cereals The histogram shows the carbohydrate...Ch. 2 - Run times One of the authors collected the times...Ch. 2 - Heart attack stays The histogram shows the lengths...Ch. 2 - Bird species 2013 The Cornell Lab of Ornithology...Ch. 2 - Super Bowl points 2016 How many points do football...Ch. 2 - Prob. 50ECh. 2 - Test scores, large class Test scores from a large...Ch. 2 - Prob. 52ECh. 2 - Mistake A clerk entering salary data into a...Ch. 2 - Sick days During contract negotiations, a company...Ch. 2 - Prob. 55ECh. 2 - Tornadoes 2015 Here are the annual numbers of...Ch. 2 - Prob. 57ECh. 2 - Tornadoes 2015 II Using the data from Exercise 56,...Ch. 2 - Pizza prices The histogram shows the distribution...Ch. 2 - Neck size The histogram shows the neck sizes (in...Ch. 2 - Pizza prices again Look again at the histogram of...Ch. 2 - Neck sizes again Look again at the histogram of...Ch. 2 - Movie lengths 2010 The histogram shows the running...Ch. 2 - Golf drives 2015 The display shows the average...Ch. 2 - Prob. 65ECh. 2 - Golf drives II 2015 Exercise 64 looked at...Ch. 2 - Prob. 67ECh. 2 - Cold weather A meteorologist preparing a talk...Ch. 2 - Gasoline 2014 In January 2014, 16 gas stations in...Ch. 2 - The great one During his 20 seasons in the NHL,...Ch. 2 - Prob. 71ECh. 2 - Prob. 72ECh. 2 - Prob. 73ECh. 2 - Prob. 74ECh. 2 - Prob. 75ECh. 2 - Prob. 76ECh. 2 - Acid rain Two researchers measured the pH (a scale...Ch. 2 - Marijuana 2015 In 2015 the Council of Europe...Ch. 2 - Prob. 79ECh. 2 - Prob. 80ECh. 2 - Prob. 81ECh. 2 - ZIP codes revisited Here are some summary...Ch. 2 - Prob. 83ECh. 2 - Prob. 84ECh. 2 - Prob. 85E
Knowledge Booster


Learn more about
Need a deep-dive on the concept behind this application? Look no further. Learn more about this topic, statistics and related others by exploring similar questions and additional content below.Similar questions
- step by step on Microssoft on how to put this in excel and the answers please Find binomial probability if: x = 8, n = 10, p = 0.7 x= 3, n=5, p = 0.3 x = 4, n=7, p = 0.6 Quality Control: A factory produces light bulbs with a 2% defect rate. If a random sample of 20 bulbs is tested, what is the probability that exactly 2 bulbs are defective? (hint: p=2% or 0.02; x =2, n=20; use the same logic for the following problems) Marketing Campaign: A marketing company sends out 1,000 promotional emails. The probability of any email being opened is 0.15. What is the probability that exactly 150 emails will be opened? (hint: total emails or n=1000, x =150) Customer Satisfaction: A survey shows that 70% of customers are satisfied with a new product. Out of 10 randomly selected customers, what is the probability that at least 8 are satisfied? (hint: One of the keyword in this question is “at least 8”, it is not “exactly 8”, the correct formula for this should be = 1- (binom.dist(7, 10, 0.7,…arrow_forwardKate, Luke, Mary and Nancy are sharing a cake. The cake had previously been divided into four slices (s1, s2, s3 and s4). What is an example of fair division of the cake S1 S2 S3 S4 Kate $4.00 $6.00 $6.00 $4.00 Luke $5.30 $5.00 $5.25 $5.45 Mary $4.25 $4.50 $3.50 $3.75 Nancy $6.00 $4.00 $4.00 $6.00arrow_forwardFaye cuts the sandwich in two fair shares to her. What is the first half s1arrow_forward
- Question 2. An American option on a stock has payoff given by F = f(St) when it is exercised at time t. We know that the function f is convex. A person claims that because of convexity, it is optimal to exercise at expiration T. Do you agree with them?arrow_forwardQuestion 4. We consider a CRR model with So == 5 and up and down factors u = 1.03 and d = 0.96. We consider the interest rate r = 4% (over one period). Is this a suitable CRR model? (Explain your answer.)arrow_forwardQuestion 3. We want to price a put option with strike price K and expiration T. Two financial advisors estimate the parameters with two different statistical methods: they obtain the same return rate μ, the same volatility σ, but the first advisor has interest r₁ and the second advisor has interest rate r2 (r1>r2). They both use a CRR model with the same number of periods to price the option. Which advisor will get the larger price? (Explain your answer.)arrow_forward
- Question 5. We consider a put option with strike price K and expiration T. This option is priced using a 1-period CRR model. We consider r > 0, and σ > 0 very large. What is the approximate price of the option? In other words, what is the limit of the price of the option as σ∞. (Briefly justify your answer.)arrow_forwardQuestion 6. You collect daily data for the stock of a company Z over the past 4 months (i.e. 80 days) and calculate the log-returns (yk)/(-1. You want to build a CRR model for the evolution of the stock. The expected value and standard deviation of the log-returns are y = 0.06 and Sy 0.1. The money market interest rate is r = 0.04. Determine the risk-neutral probability of the model.arrow_forwardSeveral markets (Japan, Switzerland) introduced negative interest rates on their money market. In this problem, we will consider an annual interest rate r < 0. We consider a stock modeled by an N-period CRR model where each period is 1 year (At = 1) and the up and down factors are u and d. (a) We consider an American put option with strike price K and expiration T. Prove that if <0, the optimal strategy is to wait until expiration T to exercise.arrow_forward
- We consider an N-period CRR model where each period is 1 year (At = 1), the up factor is u = 0.1, the down factor is d = e−0.3 and r = 0. We remind you that in the CRR model, the stock price at time tn is modeled (under P) by Sta = So exp (μtn + σ√AtZn), where (Zn) is a simple symmetric random walk. (a) Find the parameters μ and σ for the CRR model described above. (b) Find P Ste So 55/50 € > 1). StN (c) Find lim P 804-N (d) Determine q. (You can use e- 1 x.) Ste (e) Find Q So (f) Find lim Q 004-N StN Soarrow_forwardIn this problem, we consider a 3-period stock market model with evolution given in Fig. 1 below. Each period corresponds to one year. The interest rate is r = 0%. 16 22 28 12 16 12 8 4 2 time Figure 1: Stock evolution for Problem 1. (a) A colleague notices that in the model above, a movement up-down leads to the same value as a movement down-up. He concludes that the model is a CRR model. Is your colleague correct? (Explain your answer.) (b) We consider a European put with strike price K = 10 and expiration T = 3 years. Find the price of this option at time 0. Provide the replicating portfolio for the first period. (c) In addition to the call above, we also consider a European call with strike price K = 10 and expiration T = 3 years. Which one has the highest price? (It is not necessary to provide the price of the call.) (d) We now assume a yearly interest rate r = 25%. We consider a Bermudan put option with strike price K = 10. It works like a standard put, but you can exercise it…arrow_forwardIn this problem, we consider a 2-period stock market model with evolution given in Fig. 1 below. Each period corresponds to one year (At = 1). The yearly interest rate is r = 1/3 = 33%. This model is a CRR model. 25 15 9 10 6 4 time Figure 1: Stock evolution for Problem 1. (a) Find the values of up and down factors u and d, and the risk-neutral probability q. (b) We consider a European put with strike price K the price of this option at time 0. == 16 and expiration T = 2 years. Find (c) Provide the number of shares of stock that the replicating portfolio contains at each pos- sible position. (d) You find this option available on the market for $2. What do you do? (Short answer.) (e) We consider an American put with strike price K = 16 and expiration T = 2 years. Find the price of this option at time 0 and describe the optimal exercising strategy. (f) We consider an American call with strike price K ○ = 16 and expiration T = 2 years. Find the price of this option at time 0 and describe…arrow_forward
arrow_back_ios
SEE MORE QUESTIONS
arrow_forward_ios
Recommended textbooks for you
 Holt Mcdougal Larson Pre-algebra: Student Edition...AlgebraISBN:9780547587776Author:HOLT MCDOUGALPublisher:HOLT MCDOUGAL
 Glencoe Algebra 1, Student Edition, 9780079039897...AlgebraISBN:9780079039897Author:CarterPublisher:McGraw Hill
 Big Ideas Math A Bridge To Success Algebra 1: Stu...AlgebraISBN:9781680331141Author:HOUGHTON MIFFLIN HARCOURTPublisher:Houghton Mifflin Harcourt
Holt Mcdougal Larson Pre-algebra: Student Edition...
Algebra
ISBN:9780547587776
Author:HOLT MCDOUGAL
Publisher:HOLT MCDOUGAL
Glencoe Algebra 1, Student Edition, 9780079039897...
Algebra
ISBN:9780079039897
Author:Carter
Publisher:McGraw Hill
Big Ideas Math A Bridge To Success Algebra 1: Stu...
Algebra
ISBN:9781680331141
Author:HOUGHTON MIFFLIN HARCOURT
Publisher:Houghton Mifflin Harcourt
The Shape of Data: Distributions: Crash Course Statistics #7; Author: CrashCourse;https://www.youtube.com/watch?v=bPFNxD3Yg6U;License: Standard YouTube License, CC-BY
Shape, Center, and Spread - Module 20.2 (Part 1); Author: Mrmathblog;https://www.youtube.com/watch?v=COaid7O_Gag;License: Standard YouTube License, CC-BY
Shape, Center and Spread; Author: Emily Murdock;https://www.youtube.com/watch?v=_YyW0DSCzpM;License: Standard Youtube License