
Intro Stats, Books a la carte Plus NEW MyLab Statistics with Pearson eText -- Access Card Package (5th Edition)
5th Edition
ISBN: 9780134210247
Author: Richard D. De Veaux, Paul Velleman, David E. Bock
Publisher: PEARSON
expand_more
expand_more
format_list_bulleted
Concept explainers
Videos
Textbook Question
Chapter 2, Problem 45E
Cereals The histogram shows the carbohydrate content of 77 breakfast cereals (in grams).
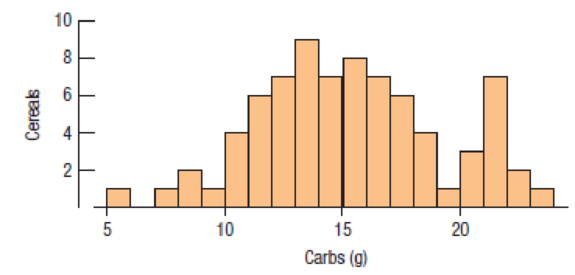
- a) Describe this distribution.
- b) If you can, open the data set and identify the cereals with the highest carbohydrate content.
Expert Solution & Answer
Want to see the full answer?
Check out a sample textbook solution
Students have asked these similar questions
Based on a sample of 100 participants, the average weight loss the first month under a new (competing) weight-loss plan is 11.4 pounds with a population standard deviation of 5.1 pounds. The average weight loss for the first month for 100 people on the old (standard) weight-loss plan is 12.8 pounds, with population standard deviation of 4.8 pounds.
Find a 90 percent confidence interval for the difference in weight loss for the two plans( old minus new)
Whats the margin of error for your calculated confidence interval?
A 95 percent confidence interval for the average miles per gallon for all cars of a certain type is 32.1, plus or minus 1.8. The interval is based on a sample of 40 randomly selected cars.
What units represent the margin of error?Suppose that you want to decrease the margin of error, but you want to keep 95 percent confidence. What should you do?
3. (i) Below is the R code for performing a X2 test on a 2×3 matrix of categorical
variables called TestMatrix:
chisq.test(Test Matrix)
(a) Assuming we have a significant result for this procedure, provide the R
code (including any required packages) for an appropriate post hoc test.
(b) If we were to apply this technique to a 2 × 2 case, how would we adapt
the code in order to perform the correct test?
(ii) What procedure can we use if we want to test for association when we
have ordinal variables? What code do we use in R to do this? What package
does this command belong to?
(iii) The following code contains the initial steps for a scenario where we are
looking to investigate the relationship between age and whether someone owns
a car by using frequencies. There are two issues with the code - please state
these.
Row3<-c(75,15)
Row4<-c(50,-10)
MortgageMatrix<-matrix(c(Row1, Row4), byrow=T, nrow=2,
MortgageMatrix
dimnames=list(c("Yes", "No"), c("40 or older","<40")))…
Chapter 2 Solutions
Intro Stats, Books a la carte Plus NEW MyLab Statistics with Pearson eText -- Access Card Package (5th Edition)
Ch. 2.3 - You may be surprised to find that you already have...Ch. 2.3 - You may be surprised to find that you already have...Ch. 2.3 - You may be surprised to find that you already have...Ch. 2.3 - Prob. 4JCCh. 2.3 - Prob. 5JCCh. 2.5 - The U.S. Census Bureau reports the median family...Ch. 2.5 - Prob. 7JCCh. 2.5 - Prob. 8JCCh. 2 - SECTION 2.1 1. Automobile fatalities The table...Ch. 2 - Nonoccupant fatalities The frequencies of traffic...
Ch. 2 - Prob. 3ECh. 2 - Movie ratings The Motion Picture Association of...Ch. 2 - Prob. 5ECh. 2 - Marriage in decline Changing attitudes about...Ch. 2 - Traffic fatalities 2013 Here are two histograms...Ch. 2 - Prob. 8ECh. 2 - Prob. 9ECh. 2 - Prob. 10ECh. 2 - E-mails A university teacher saved every e-mail...Ch. 2 - Adoptions The U.S. Census Bureau keeps track of...Ch. 2 - Biceps revisited Describe the shape of the...Ch. 2 - E-mails II For the distribution of e-mails sent by...Ch. 2 - Life expectancy Here are the life expectancies at...Ch. 2 - Prob. 16ECh. 2 - Life expectancy II For the 146 life expectancies...Ch. 2 - Adoptions II For the number of adoptions in...Ch. 2 - How big is your bicep II? For the bicep...Ch. 2 - Shoe sizes II For the shoe sizes in Exercise 16,...Ch. 2 - SECTION 2.5 21. Life expectancy III For the 190...Ch. 2 - Prob. 22ECh. 2 - How big is your bicep III? For the bicep...Ch. 2 - Prob. 24ECh. 2 - Thinking about shape Would you expect...Ch. 2 - More shapes Would you expect distributions of...Ch. 2 - Movie genres again Here is a bar chart summarizing...Ch. 2 - Prob. 36ECh. 2 - Prob. 37ECh. 2 - Prob. 38ECh. 2 - Prob. 39ECh. 2 - Prob. 40ECh. 2 - Prob. 41ECh. 2 - Prob. 42ECh. 2 - Prob. 43ECh. 2 - Modalities A survey of athletic trainers asked...Ch. 2 - Cereals The histogram shows the carbohydrate...Ch. 2 - Run times One of the authors collected the times...Ch. 2 - Heart attack stays The histogram shows the lengths...Ch. 2 - Bird species 2013 The Cornell Lab of Ornithology...Ch. 2 - Super Bowl points 2016 How many points do football...Ch. 2 - Prob. 50ECh. 2 - Test scores, large class Test scores from a large...Ch. 2 - Prob. 52ECh. 2 - Mistake A clerk entering salary data into a...Ch. 2 - Sick days During contract negotiations, a company...Ch. 2 - Prob. 55ECh. 2 - Tornadoes 2015 Here are the annual numbers of...Ch. 2 - Prob. 57ECh. 2 - Tornadoes 2015 II Using the data from Exercise 56,...Ch. 2 - Pizza prices The histogram shows the distribution...Ch. 2 - Neck size The histogram shows the neck sizes (in...Ch. 2 - Pizza prices again Look again at the histogram of...Ch. 2 - Neck sizes again Look again at the histogram of...Ch. 2 - Movie lengths 2010 The histogram shows the running...Ch. 2 - Golf drives 2015 The display shows the average...Ch. 2 - Prob. 65ECh. 2 - Golf drives II 2015 Exercise 64 looked at...Ch. 2 - Prob. 67ECh. 2 - Cold weather A meteorologist preparing a talk...Ch. 2 - Gasoline 2014 In January 2014, 16 gas stations in...Ch. 2 - The great one During his 20 seasons in the NHL,...Ch. 2 - Prob. 71ECh. 2 - Prob. 72ECh. 2 - Prob. 73ECh. 2 - Prob. 74ECh. 2 - Prob. 75ECh. 2 - Prob. 76ECh. 2 - Acid rain Two researchers measured the pH (a scale...Ch. 2 - Marijuana 2015 In 2015 the Council of Europe...Ch. 2 - Prob. 79ECh. 2 - Prob. 80ECh. 2 - Prob. 81ECh. 2 - ZIP codes revisited Here are some summary...Ch. 2 - Prob. 83ECh. 2 - Prob. 84ECh. 2 - Prob. 85E
Knowledge Booster


Learn more about
Need a deep-dive on the concept behind this application? Look no further. Learn more about this topic, statistics and related others by exploring similar questions and additional content below.Similar questions
- Describe the situation in which Fisher’s exact test would be used?(ii) When do we use Yates’ continuity correction (with respect to contingencytables)?[2 Marks] 2. Investigate, checking the relevant assumptions, whether there is an associationbetween age group and home ownership based on the sample dataset for atown below:Home Owner: Yes NoUnder 40 39 12140 and over 181 59Calculate and evaluate the effect size.arrow_forwardNot use ai pleasearrow_forwardNeed help with the following statistic problems.arrow_forward
- Need help with the following questions on statistics.arrow_forwardNeed help with these following statistic questions.arrow_forward2PM Tue Mar 4 7 Dashboard Calendar To Do Notifications Inbox File Details a 25/SP-CIT-105-02 Statics for Technicians Q-7 Determine the resultant of the load system shown. Locate where the resultant intersects grade with respect to point A at the base of the structure. 40 N/m 2 m 1.5 m 50 N 100 N/m Fig.- Problem-7 4 m Gradearrow_forward
- Nsjsjsjarrow_forwardA smallish urn contains 16 small plastic bunnies - 9 of which are pink and 7 of which are white. 10 bunnies are drawn from the urn at random with replacement, and X is the number of pink bunnies that are drawn. (a) P(X=6)[Select] (b) P(X>7) ≈ [Select]arrow_forwardA smallish urn contains 25 small plastic bunnies - 7 of which are pink and 18 of which are white. 10 bunnies are drawn from the urn at random with replacement, and X is the number of pink bunnies that are drawn. (a) P(X = 5)=[Select] (b) P(X<6) [Select]arrow_forward
- Elementary StatisticsBase on the same given data uploaded in module 4, will you conclude that the number of bathroom of houses is a significant factor for house sellprice? I your answer is affirmative, you need to explain how the number of bathroom influences the house price, using a post hoc procedure. (Please treat number of bathrooms as a categorical variable in this analysis)Base on the same given data, conduct an analysis for the variable sellprice to see if sale price is influenced by living area. Summarize your finding including all regular steps (learned in this module) for your method. Also, will you conclude that larger house corresponding to higher price (justify)?Each question need to include a spss or sas output. Instructions: You have to use SAS or SPSS to perform appropriate procedure: ANOVA or Regression based on the project data (provided in the module 4) and research question in the project file. Attach the computer output of all key steps (number) quoted in…arrow_forwardElementary StatsBase on the given data uploaded in module 4, change the variable sale price into two categories: abovethe mean price or not; and change the living area into two categories: above the median living area ornot ( your two group should have close number of houses in each group). Using the resulting variables,will you conclude that larger house corresponding to higher price?Note: Need computer output, Ho and Ha, P and decision. If p is small, you need to explain what type ofdependency (association) we have using an appropriate pair of percentages. Please include how to use the data in SPSS and interpretation of data.arrow_forwardAn environmental research team is studying the daily rainfall (in millimeters) in a region over 100 days. The data is grouped into the following histogram bins: Rainfall Range (mm) Frequency 0-9.9 15 10 19.9 25 20-29.9 30 30-39.9 20 ||40-49.9 10 a) If a random day is selected, what is the probability that the rainfall was at least 20 mm but less than 40 mm? b) Estimate the mean daily rainfall, assuming the rainfall in each bin is uniformly distributed and the midpoint of each bin represents the average rainfall for that range. c) Construct the cumulative frequency distribution and determine the rainfall level below which 75% of the days fall. d) Calculate the estimated variance and standard deviation of the daily rainfall based on the histogram data.arrow_forward
arrow_back_ios
SEE MORE QUESTIONS
arrow_forward_ios
Recommended textbooks for you
 Holt Mcdougal Larson Pre-algebra: Student Edition...AlgebraISBN:9780547587776Author:HOLT MCDOUGALPublisher:HOLT MCDOUGAL
 Glencoe Algebra 1, Student Edition, 9780079039897...AlgebraISBN:9780079039897Author:CarterPublisher:McGraw Hill
 Big Ideas Math A Bridge To Success Algebra 1: Stu...AlgebraISBN:9781680331141Author:HOUGHTON MIFFLIN HARCOURTPublisher:Houghton Mifflin Harcourt
Holt Mcdougal Larson Pre-algebra: Student Edition...
Algebra
ISBN:9780547587776
Author:HOLT MCDOUGAL
Publisher:HOLT MCDOUGAL
Glencoe Algebra 1, Student Edition, 9780079039897...
Algebra
ISBN:9780079039897
Author:Carter
Publisher:McGraw Hill
Big Ideas Math A Bridge To Success Algebra 1: Stu...
Algebra
ISBN:9781680331141
Author:HOUGHTON MIFFLIN HARCOURT
Publisher:Houghton Mifflin Harcourt
Which is the best chart: Selecting among 14 types of charts Part II; Author: 365 Data Science;https://www.youtube.com/watch?v=qGaIB-bRn-A;License: Standard YouTube License, CC-BY