1 Introduction: The Nature Of Science And Physics 2 Kinematics 3 Two-dimensional Kinematics 4 Dynamics: Force And Newton's Laws Of Motion 5 Further Applications Of Newton's Laws: Friction, Drag, And Elasticity 6 Uniform Circular Motion And Gravitation 7 Work, Energy, And Energy Resources 8 Linear Momentum And Collisions 9 Statics And Torque 10 Rotational Motion And Angular Momentum 11 Fluid Statics 12 Fluid Dynamics And Its Biological And Medical Applications 13 Temperature, Kinetic Theory, And The Gas Laws 14 Heat And Heat Transfer Methods 15 Thermodynamics 16 Oscillatory Motion And Waves 17 Physics Of Hearing 18 Electric Charge And Electric Field 19 Electric Potential And Electric Field 20 Electric Current, Resistance, And Ohm's Law 21 Circuits And Dc Instruments 22 Magnetism 23 Electromagnetic Induction, Ac Circuits, And Electrical Technologies 24 Electromagnetic Waves 25 Geometric Optics 26 Vision And Optical Instruments 27 Wave Optics 28 Special Relativity 29 Introduction To Quantum Physics 30 Atomic Physics 31 Radioactivity And Nuclear Physics 32 Medical Applications Of Nuclear Physics 33 Particle Physics 34 Frontiers Of Physics expand_more
Chapter Questions expand_more
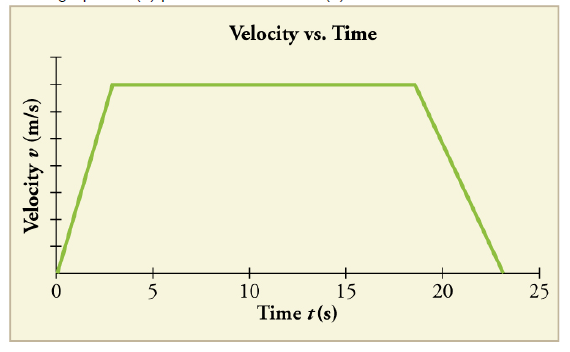
Problem 1CQ: Give an example in which there are clear distinctions among distance traveled, displacement, and... Problem 2CQ: Under what circumstances does distance traveled equal magnitude of displacement? What is the only... Problem 3CQ: Bacteria move back and f01th by using their flagella (Structures that look like little tails).... Problem 4CQ: A student writes, "A bird that is diving for prey has a speed of -10 m / s." What is wrong with the... Problem 5CQ: What is the speed of the bird in Exercise 2.4? Problem 6CQ: Acceleration is the change in velocity over time. Given this information, is acceleration a vector... Problem 7CQ: A weather forecast states that the temperature is predicted to be -5°C the following day. Is this... Problem 8CQ: Give an example (but not one from the text) of a device used to measure time and identify what... Problem 9CQ: There is a distinction between average speed and the magnitude of average velocity. Give an example... Problem 10CQ: Does a car's odometer measure position or displacement? Does its speedometer measure speed or... Problem 11CQ: If you divide the total distance traveled on a car trip (as determined by the odometer) by the time... Problem 12CQ: How are instantaneous velocity and instantaneous speed related to one another? How do they differ? Problem 13CQ: Is it possible for speed to be constant while acceleration is not zero? Give an example of such a... Problem 14CQ: Is it possible for velocity to be constant while acceleration is not zero? Explain. Problem 15CQ: Give an example in which velocity is zero yet acceleration is not. Problem 16CQ: If a subway train is moving to the left (has a negative velocity) and then comes to a stop, what is... Problem 17CQ: Plus and minus signs are used in one-dimensional motion to indicate direction. What is the sign of... Problem 18CQ: What information do you need in order to choose which equation or equations to use to solve a... Problem 19CQ: What is the last thing you should do when solving a problem? Explain. Problem 20CQ: What is the acceleration of a rock thrown straight upward on the way up? At the top of its flight?... Problem 21CQ: An object that is thrown straight up falls back to Earth. This is one-dimensional motion. (a) When... Problem 22CQ: Suppose you throw a rock nearly straight up at a coconut in a palm tree, and the rock misses on the... Problem 23CQ: If an object is thrown straight up and air resistance is negligible, then its speed when it returns... Problem 24CQ: The severity of a fall depends on your speed when you strike the ground. All factors but the... Problem 25CQ: How many times higher could an astronaut jump on the Moon than on Earth if his takeoff speed is the... Problem 26CQ: (a) Explain how you can use the graph of position versus time in Figure 2.54 to describe the change... Problem 27CQ: (a) Sketch a graph of velocity versus time corresponding to the graph of displacement versus time... Problem 28CQ: (a) Explain how you can determine the acceleration over time from a velocity versus time graph such... Problem 29CQ: (a) Sketch a graph of acceleration versus time corresponding to the graph of velocity versus time... Problem 30CQ: Consider the velocity vs. time graph of a person in an elevator shown in Figure 2.58. Suppose the... Problem 31CQ: A cylinder is given a push and then rolls up an inclined plane. If the origin is the starting point,... Problem 1PE: Find the following for path A in Figure 2.59: (a) The distance traveled. (b) The magnitude of the... Problem 2PE: Find the following for path B in Figure 2.59: (a) The distance traveled. (b) The magnitude of the... Problem 3PE: Find the following for path C in Figure 2.59: (a) The distance traveled. (b) The magnitude of the... Problem 4PE: Find the following for path D in Figure 2.59: (a) The distance traveled. (b) The magnitude of the... Problem 5PE: (a) Calculate Earth's average speed relative to the Sun. (b) What is its average velocity over a... Problem 6PE: A helicopter blade spins at exactly 100 revolutions per minute. Its tip is 5.00 m from the center of... Problem 7PE: The North American and European continents are moving apart at a rate of about 3 cm/y. At this rate... Problem 8PE: Land west of the San Andreas fault in southern California is moving at an average velocity of about... Problem 9PE: On May 26, 1934, a streamlined, stainless steel diesel train called the Zephyr set the world's... Problem 10PE: Tidal friction is slowing the rotation of the Earth. As a result, the orbit of the Moon is... Problem 11PE: A student drove to the university from her home and noted that the odometer reading of her car... Problem 12PE: The speed of propagation of the action potential (an electrical signal) in a nerve cell depends... Problem 13PE: Conversations with astronauts on the lunar surface were characterized by a kind of echo in which the... Problem 14PE: A football quarterback runs 15.0 m straight down the playing field in 2.50 s. He is then hit and... Problem 15PE: The planetary model of the atom pictures electrons orbiting the atomic nucleus much as planets orbit... Problem 16PE: A cheetah can accelerate from rest to a speed of 30.0 m/s in 7.00 s. What is its acceleration? Problem 17PE: Professional Application Dr. John Paul Stapp was U.S. Air Force officer who studied the effects of... Problem 18PE: A commuter backs her car out of her garage with an acceleration of 1.40 m/s2. (a) How long does it... Problem 19PE: Assume that an intercontinental ballistic missile goes from rest to a suborbital speed of 6.50 km/s... Problem 20PE: An Olympic-class sprinter starts a race with an acceleration of 4.50 m/s2. (a) What is her speed... Problem 21PE: A well-thrown ball is caught in a well-padded mitt. If the deceleration of the ball is 2.10104 m/s2,... Problem 22PE: A bullet in a gun is accelerated from the firing chamber to the end of the barrel at an average rate... Problem 23PE: (a) A light-rail commuter train accelerates at a rate of 1.35 m/s2. How long does it take to reach... Problem 24PE: While entering a freeway, a car accelerates from rest at a rate of 2.40 m/s2 for 12.0 s. (a) Draw a... Problem 25PE: At the end of a race, a runner decelerates from a velocity of 9.00 m/s at a rate of 2.00 m/s2. (a)... Problem 26PE: Professional Application: Blood is accelerated from rest to 30.0 cm/s in a distance of 1.80 cm by... Problem 27PE: In a slap shot, a hockey player accelerates the puck from a velocity of 8.00 m/s to 40.0 m/s in the... Problem 28PE: A powerful motorcycle can accelerate from rest to 26.8 m/s (100 km/h) in only 3.90 s. (a) What is... Problem 29PE: Freight trains can produce only relatively small accelerations and decelerations. (a) What is the... Problem 30PE: A fireworks shell is accelerated from rest to a velocity of 65.0 m/s over a distance of 0.250 m. (a)... Problem 31PE: A swan on a lake gets airborne by flapping its wings and running on top of the water. (a) If the... Problem 32PE: Professional Application: A woodpecker's brain is specially protected from large decelerations by... Problem 33PE: An unwary football player collides with a padded goalpost while running at a velocity of 7.50 m/s... Problem 34PE: In World War II, there were several reported cases of airmen who jumped from their flaming airplanes... Problem 35PE: Consider a grey squirrel falling out of a tree to the ground. (a) If we ignore air resistance in... Problem 36PE: An express train passes through a station. It enters with an initial velocity of 22.0 m/s and... Problem 37PE: Dragsters can actually reach a top speed of 145 m/s in only 4.45 s—considerably less time than given... Problem 38PE: A bicycle racer sprints at the end of a race to clinch a victory. The racer has an initial velocity... Problem 39PE: In 1967, New Zealander Burt Munro set the world record for an Indian motorcycle, on the Bonneville... Problem 40PE: (a) A world record was set for the men's 100-m dash in the 2008 Olympic Games in Beijing by Usain... Problem 41PE: Calculate the displacement and velocity at times of (a) 0.500, (b) 1.00, (c) 1.50, and (d) 2.00 s... Problem 42PE: Calculate the displacement and velocity at times of (a) 0.500, (b) 1.00, (c) 1.50, (d) 2.00, and (e)... Problem 43PE: A basketball referee tosses the ball straight up for the starting tip-off. At what velocity must a... Problem 44PE: A rescue helicopter is hovering over a person whose boat has sunk. One of the rescuers throws a life... Problem 45PE: A dolphin in an aquatic show jumps straight up out of the water at a velocity of 13.0 m/s. (a) List... Problem 46PE: A swimmer bounces straight up from a diving board and falls feet first into a pool. She starts with... Problem 47PE: (a) Calculate the height of a cliff if it takes 2.35 s for a rock to hit the ground when it is... Problem 48PE: A very strong, but inept, shot putter puts the shot straight up vertically with an initial velocity... Problem 49PE: You throw a ball straight up with an initial velocity of 15.0 m/s. It passes a tree branch on the... Problem 50PE: A kangaroo can jump over an object 2.50 m high. (a) Calculate its vertical speed when it leaves the... Problem 51PE: Standing at the base of one of the cliffs of Mt. Arapiles in Victoria, Australia, a hiker hears a... Problem 52PE: An object is dropped from a height of 75.0 m above ground level. (a) Determine the distance traveled... Problem 53PE: There is a 250-m-high cliff at Half Dome in Yosemite National Park in California. Suppose a boulder... Problem 54PE: A ball is thrown straight up. It passes a 2.00-m-high window 7.50 m off the ground on its path up... Problem 55PE: Suppose you drop a rock into a dark well and, using precision equipment, you measure the time for... Problem 56PE: A steel ball is dropped onto a hard floor from a height of 1.50 m and rebounds to a height of 1.45... Problem 57PE: A coin is dropped from a hot-air balloon that is 300 m above the ground and rising at 10.0 m/s... Problem 58PE: A soft tennis ball is dropped onto a hard floor from a height of 1.50 m and rebounds to a height of... Problem 59PE: (a) By taking the slope of the curve in Figure 2.60, verify that the velocity of the jet car is 115... Problem 60PE: Using approximate values, calculate the slope of the curve in Figure 2.62 to verify that the... Problem 61PE: Using approximate values, calculate the slope of the curve in Figure 2.62 to verify that the... Problem 62PE: By taking the slope of the curve in Figure 2.63, verify that the acceleration is 3.2 m/s2 at t=10 s. Problem 63PE: Construct the displacement graph for the subway shuttle train as shown in Figure 2.18(a). Your graph... Problem 64PE: (a) Take the slope of the curve in Figure 2.64 to find the jogger's velocity at t=2.5 s. (b) Repeat... Problem 65PE: A graph of v(t) is shown for a world-class track sprinter in a 100-m race. (See Figure 2.67). (a)... Problem 66PE: Figure 2.68 shows the displacement graph for a particle for 5 s. Draw the corresponding velocity and... format_list_bulleted