DATA In your physics lab you release a small glider from rest at various points on a long, frictionless air track that is inclined at an angle θ above the horizontal. With an electronic photocell, you measure the time t it takes the glider to slide a distance x from the release point to the bottom of the track. Your measurements are given in Fig. P2.84 , which shows a Figure P2.84 second-order polynomial (quadratic) fit to the plotted data. You are asked to find the glider’s acceleration, which is assumed to be constant. There is some error in each measurement, so instead of using a single set of x and t values, you can be more accurate if you use graphical methods and obtain your measured value of the acceleration from the graph, (a) How can you re-graph the data so that the data points fall close to a straight line? ( Hint: You might want to plot x or t , or both, raised to some power.) (b) Construct the graph you described in part (a) and find the equation for the straight line that is the best fit to the data points, (c) Use the straight-line fit from part (b) to calculate the acceleration of the glider, (d) The glider is released at a distance x = 1.35 m from the bottom of the track. Use the acceleration value you obtained in part (c) to calculate the speed of the glider when it reaches the bottom of the track.
DATA In your physics lab you release a small glider from rest at various points on a long, frictionless air track that is inclined at an angle θ above the horizontal. With an electronic photocell, you measure the time t it takes the glider to slide a distance x from the release point to the bottom of the track. Your measurements are given in Fig. P2.84 , which shows a Figure P2.84 second-order polynomial (quadratic) fit to the plotted data. You are asked to find the glider’s acceleration, which is assumed to be constant. There is some error in each measurement, so instead of using a single set of x and t values, you can be more accurate if you use graphical methods and obtain your measured value of the acceleration from the graph, (a) How can you re-graph the data so that the data points fall close to a straight line? ( Hint: You might want to plot x or t , or both, raised to some power.) (b) Construct the graph you described in part (a) and find the equation for the straight line that is the best fit to the data points, (c) Use the straight-line fit from part (b) to calculate the acceleration of the glider, (d) The glider is released at a distance x = 1.35 m from the bottom of the track. Use the acceleration value you obtained in part (c) to calculate the speed of the glider when it reaches the bottom of the track.
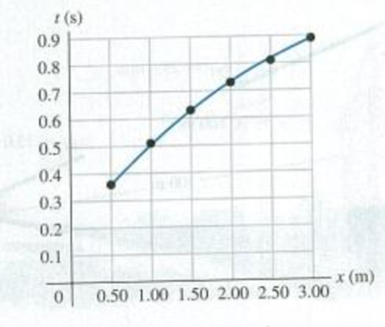
DATA In your physics lab you release a small glider from rest at various points on a long, frictionless air track that is inclined at an angle θ above the horizontal. With an electronic photocell, you measure the time t it takes the glider to slide a distance x from the release point to the bottom of the track. Your measurements are given in Fig. P2.84, which shows a
Figure P2.84
second-order polynomial (quadratic) fit to the plotted data. You are asked to find the glider’s acceleration, which is assumed to be constant. There is some error in each measurement, so instead of using a single set of x and t values, you can be more accurate if you use graphical methods and obtain your measured value of the acceleration from the graph, (a) How can you re-graph the data so that the data points fall close to a straight line? (Hint: You might want to plot x or t, or both, raised to some power.) (b) Construct the graph you described in part (a) and find the equation for the straight line that is the best fit to the data points, (c) Use the straight-line fit from part (b) to calculate the acceleration of the glider, (d) The glider is released at a distance x = 1.35 m from the bottom of the track. Use the acceleration value you obtained in part (c) to calculate the speed of the glider when it reaches the bottom of the track.
Statistical thermodynamics. The number of imaginary replicas of a system of N particlesa) cannot be greater than Avogadro's numberb) must always be greater than Avogadro's number.c) has no relation to Avogadro's number.
Lab-Based Section
Use the following information to answer the lab based scenario.
A student performed an experiment in an attempt to determine the index of refraction of glass.
The student used a laser and a protractor to measure a variety of angles of incidence and
refraction through a semi-circular glass prism. The design of the experiment and the student's
results are shown below.
Angle of
Incidence (°)
Angle of
Refraction (º)
20
11
30
19
40
26
50
31
60
36
70
38
2a) By hand (i.e., without using computer software), create a linear graph on graph paper
using the student's data. Note: You will have to manipulate the data in order to achieve a
linear function.
2b) Graphically determine the index of refraction of the semi-circular glass prism, rounding your
answer to the nearest hundredth.
Use the following information to answer the next two questions.
A laser is directed at a prism made of zircon (n = 1.92) at an incident angle of 35.0°, as shown in
the diagram.
3a) Determine the critical angle of zircon.
35.0°
70°
55
55°
3b) Determine the angle of refraction when the laser beam leaves the prism.
Chapter 2 Solutions
University Physics with Modern Physics (14th Edition)
Need a deep-dive on the concept behind this application? Look no further. Learn more about this topic, physics and related others by exploring similar questions and additional content below.


 Principles of Physics: A Calculus-Based TextPhysicsISBN:9781133104261Author:Raymond A. Serway, John W. JewettPublisher:Cengage Learning
 Glencoe Physics: Principles and Problems, Student...PhysicsISBN:9780078807213Author:Paul W. ZitzewitzPublisher:Glencoe/McGraw-Hill
 Physics for Scientists and Engineers: Foundations...PhysicsISBN:9781133939146Author:Katz, Debora M.Publisher:Cengage Learning
 College PhysicsPhysicsISBN:9781285737027Author:Raymond A. Serway, Chris VuillePublisher:Cengage Learning
 Physics for Scientists and Engineers, Technology ...PhysicsISBN:9781305116399Author:Raymond A. Serway, John W. JewettPublisher:Cengage Learning
 Physics for Scientists and Engineers with Modern ...PhysicsISBN:9781337553292Author:Raymond A. Serway, John W. JewettPublisher:Cengage Learning