
Concept explainers
Videos
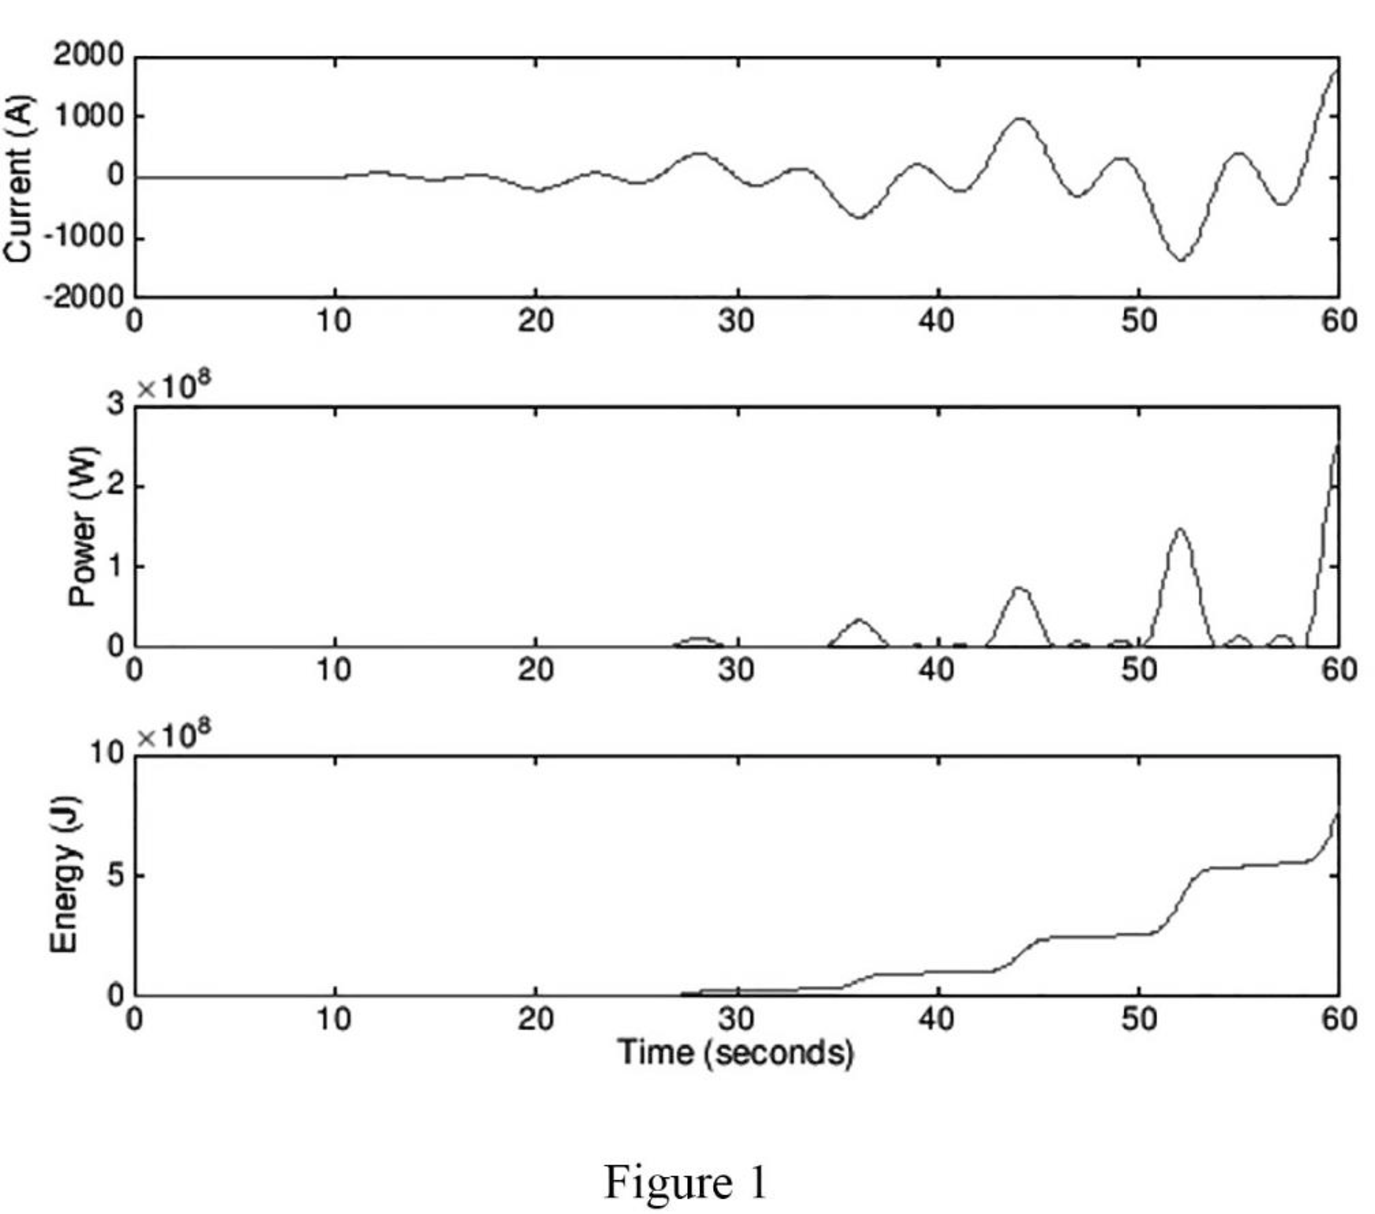
A wind power system with increasing windspeed has the current waveform described by the equation below, delivered to an 80 Ω resistor. Plot the current, power, and energy waveform over a period of 60 s, and calculate the total energy collected over the 60 s time period.
Sketch the current, power, and energy waveform over a period of 60 s to the current waveform of the wind power system. Also calculate the total energy collected over the 60 s time period.
Answer to Problem 22E
The plot for the current, power, and energy waveform is sketched as shown in Figure 1, and the total energy collected over the 60 s time period is
Explanation of Solution
Given data:
The current waveform is,
The resistor is
Formula used:
Write the general expression to find the power as follows,
Write the general expression to find the energy as follows,
Calculation:
Substitute the value of
Applying equation (3) in equation (2) as follows,
Consider the function,
Consider
Substituting the values in equation (5) as follows,
Consider,
Applying the product to sum formulas in the above expression as follows,
Consider,
By applying integration by parts in the above expression,
Applying the values in equation (8) as follows,
Consider the function,
Solving,
By applying integration by parts in the above expression,
Applying the values in the above equation as follows,
Consider,
Solving,
By applying integration by parts in the above expression,
Applying the values in the above equation as follows,
Consider,
Solving,
By applying integration by parts in the above expression,
Applying the values in the above equation as follows,
Consider,
Let,
Applying the values in the above expression,
Substituting the values in equation (13) as follows,
Substitute the above value in the considered expression
Substitute the above value in equation (12) as follows,
Substitute the above value in equation (11) as follows,
Substitute the above value in equation (10) as follows,
Substitute the above value in equation (9) as follows,
Consider the function
Applying integration by parts in the above expression,
Applying the values in the above equation as follows,
Consider,
Let,
Applying integration by parts in the above expression,
Applying the values in the above equation as follows,
Consider,
Let,
Applying integration by parts in the above expression,
Applying the values in the above equation as follows,
Consider,
Let,
Applying integration by parts in the above expression,
Applying the values in the above equation as follows,
Consider,
Let,
Substituting the values,
Substitute the above value in equation (22) as follows,
Substitute the above value in equation (21) as follows,
Substitute the above value in equation (20) as follows,
Substitute the above value in equation (18) as follows
Substitute the above value in equation (17) as follows
Substitute the above value in equation (16) as follows
Substitute the above value in equation (15) as follows
Consider the function
Applying integration by parts in the above expression,
Applying the values in the above equation as follows,
Consider,
Let,
Applying integration by parts in the above expression,
Applying the values in the above equation as follows,
Consider,
Let,
Applying integration by parts in the above expression,
Applying the values in the above equation as follows,
Consider,
Let,
Applying integration by parts in the above expression,
Applying the values in the above equation as follows,
Consider,
Let,
Applying the values in the above equation as follows,
Substitute the above value in equation (33) as follows,
Substitute the above value in equation (31) as follows,
Substitute the above value in equation (30) as follows,
Substitute the above value in equation (29) as follows,
Substitute the above value in equation (28) as follows,
Substitute the above value in equation (26) as follows,
Substitute the above value in equation (25) as follows,
Consider the function
Substitute the calculated values of equation (34), (35), (23), and (14) in the expression x as follows,
Substitute the above value in equation (6) as follows,
Substitute
Applying the limits to the above expression over a period of 60 s,
Matlab code to plot for wind power waveform:
t_end = 60; % End time in seconds
t_pts = 600; % Number of points for time vector
t=linspace(0,t_end,t_pts); % Define time vector
dt=t_end/t_pts; % Separation between time points
R=80; % Resistance in ohms
for i=1:t_pts; % Iterate for each point in time
current(i)=0.5*t(i)^2*sin(pi/8*t(i))*cos(pi/4*t(i));
p(i)=current(i)^2*R;
end
w=cumsum(p)*dt; % Energy from cumulative sum times time separation
figure(1)
subplot(3,1,1); plot(t,current,'r'); % Plot voltage
ylabel('Current (A)');
subplot(3,1,2); plot(t,p,'r') % Plot power
ylabel('Power (W)')
subplot(3,1,3); plot(t,w,'r') % Plot energy
xlabel('Time (seconds)')
ylabel('Energy (J)')
Matlab output:
Figure 1 shows the plot for the current, power, and energy waveform.
Conclusion:
Thus, the plot for the current, power, and energy waveform is sketched as shown in Figure 1, and the total energy collected over the 60 s time period is
Want to see more full solutions like this?
Chapter 2 Solutions
ENGINEERING CIRCUIT...(LL)>CUSTOM PKG.<


- Calculate the voltage gain and I/O impedance of circuits shown in Fig. 1. Assume (60 points- each section 20 points) J Vina кат Vb J Vina кат VCC VCC VCC Vino - Vout - Vout Rs w Q2 Q2 (c) (b) Q2 = (a) - Voutarrow_forwardNot use ai please letarrow_forwardUse PSpice to create the circuit and show the circuit along with simulation results. Also please explicitly answer the question (i.e. have the answer make sense and not in parts where there is no final answer.)arrow_forward
- Problem 5 Plot the impulse response of the system shown below. Hint: This is done graphically with 4 convolutions. x[n] D y[n]< D D D D D D D D D D Darrow_forwardUse PSpice to create the circuit. Also please explicitly answer whether the load line intersects the -0.7 line at the computed point.arrow_forwardIn class, we wrote on the blackboard a byte addressable memory where each element was 2 nibbles: For example: Main memory A Address Offset Data Data Data Data Data Data Data Data Data Data Data Data Data Data Data Data 0 1 2 3 4 5 6 0 Ox10 0x00 0x02 0x2B Ox4F 0x00 0x00 0x00 0x11 0x12 0x20 0x10 0x10 0x00 OxFF Ox3E DxDD 0x00 0x00 0x00 0x00 0x00 0x00 0x00 7 0x1C 0x00 8 9 A 0x00 0x00 0x01 0x00 0x00 0x01 0x00 0x00 0x01 B с D E 0x00 0x05 0x04 0x03 0x02 0x00 Ox3D 0x00 0x1C Ox2F 0x00 Ox1F OxFF 0x03 0x02 F What is the contents of address 0x1C in main memory A for a 32 bit machine using Big Endian format? What is the contents of address 0x1C in main memory A for a 16 bit machine using Little Endian format? What is the contents of the indirect address at 0x04 in main memory A for a Big Endian 32 bit machine ((0x4))? What is the contents of 4(0x10) in main memory A for a 16 bit Little Endian machine? What is the contents of the address 16(0xC) for a 64 bit Little Endian machine?arrow_forward
- Problem 4 Consider the system shown below where h₁[n] = {2,1,2} and h₂[n] = (n+1) u[n] (− means subtraction). h₂[n] x [n]- h₁[n] бел-27- h₂[n] y[n] (a) Determine the impulse response of the system and plot it for n = -3,...,6. (b) Determine graphically the response of the system to the following input. x[n] 2 4 5arrow_forwardNot use ai pleasearrow_forwardDesign a self-biased JFET circuit (Fig. 6) assuming VGS(0) = -1.3 and ipss= 20 mA. We require a VGS = -0.7. Assume a supply voltage of 15 volts. Draw the load line for this circuit using Fig. 4b once you have selected the appropriate values for the components. Does the load line intersect the VGS = -0.7 volt line at the computed in point? RD. RG Rs 12 20nA GS = -1.3 VGS 10nA Fig. 6. Circuit for Examples 2 &3. 50 100 150 200 □ ID(J1) UDS Fig. 4b. The IV characteristics of an n-channel JFET (J113). The plots are for VGs increments of 0.05 volts. VGS(0) -1.3. The yellow and blue load lines are for examples 2 &3, respectively.arrow_forward
- Find the operating point and the load line of a voltage-divider JFET biasing circuit using the following parameters: VGS(0) = -1.3 and Vcc = 15 volts. Assume ipss = 20 mA, RG₁ = RG2 = 10 kn, RD = 300, and Rs = 1 kn. Use Fig. 4b for the IV characteristic of the JFET. 20nA GS=-1.3 GS 10nA- 50 100 150 200 ID(J1) UDS Fig. 4b. The IV characteristics of an n-channel JFET (J113). The plots are for VGs increments of 0.05 volts. VGS(0) -1.3. The yellow and blue load lines are for examples 2 &3, respectively.arrow_forwardDesign the JFET circuit for the largest in swing. Use the self-bias circuit shown in Fig. 6. Assume that VGS (0) = -1.3 and Vcc = 15 volts. Furthermore, assume that ipss = 20 mA. Using Fig. 4b, draw the load line and identify the Q point. Explain why this will allow the largest swing. Use ip = ipss (1- VGS VGS(0) to show what happens to i, and vps when you have a swing of 0.2 volts in vcs form its operating point (that is, change vas by ±0.2 volts and compute the corresponding iD and VDs). RD RG Rs 0 20nA GS=-1.3 VGS 12 10nA -0- Fig. 6. Circuit for Examples 2 &3. BA-C 50 100 150 200 □ ID(J1) UDS Fig. 4b. The IV characteristics of an n-channel JFET (J113). The plots are for VGs increments of 0.05 volts. VGS(0) -1.3. The yellow and blue load lines are for examples 2 &3, respectively.arrow_forwardplease do the correct VI chrastaristics curve on excel. I am not sure if mine is correctarrow_forward
