Concept explainers
Videos
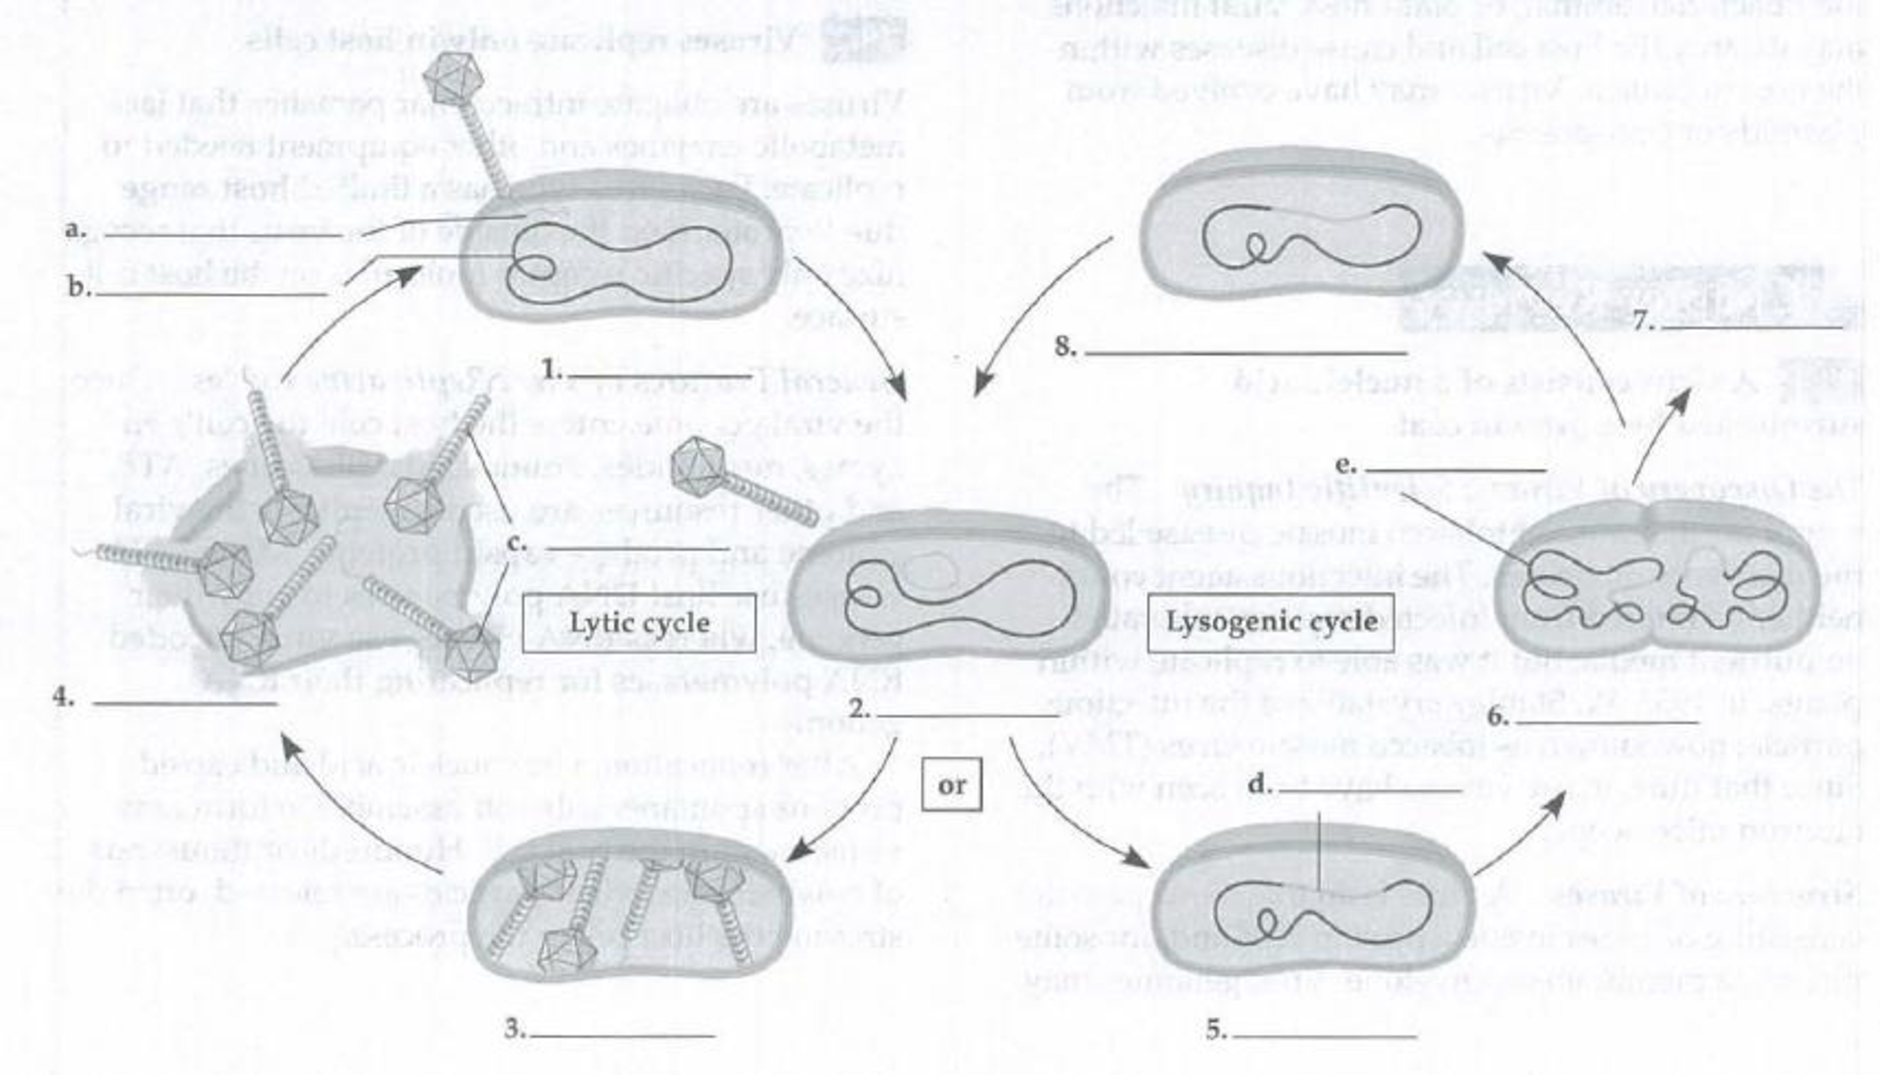
In the following diagram of lytic and lysogenic cycles, describe steps numbered 1-8 and label structures a-e.
To list and describe: The following diagram is of lytic and lysogenic cycle.
Introduction: Virus is an infectious agent that cannot be seen through the naked eyes. Virology is the study of viruses and virologists are the biologists who study viruses. Viruses are obligate intracellular parasites because it needs a living host cell for replication. Obligate intracellular parasites do not have the ability to reproduce outside their host cell.
Answer to Problem 1IQ
Pictorial representation: The lytic and lysogenic cycle is shown in Fig.1.
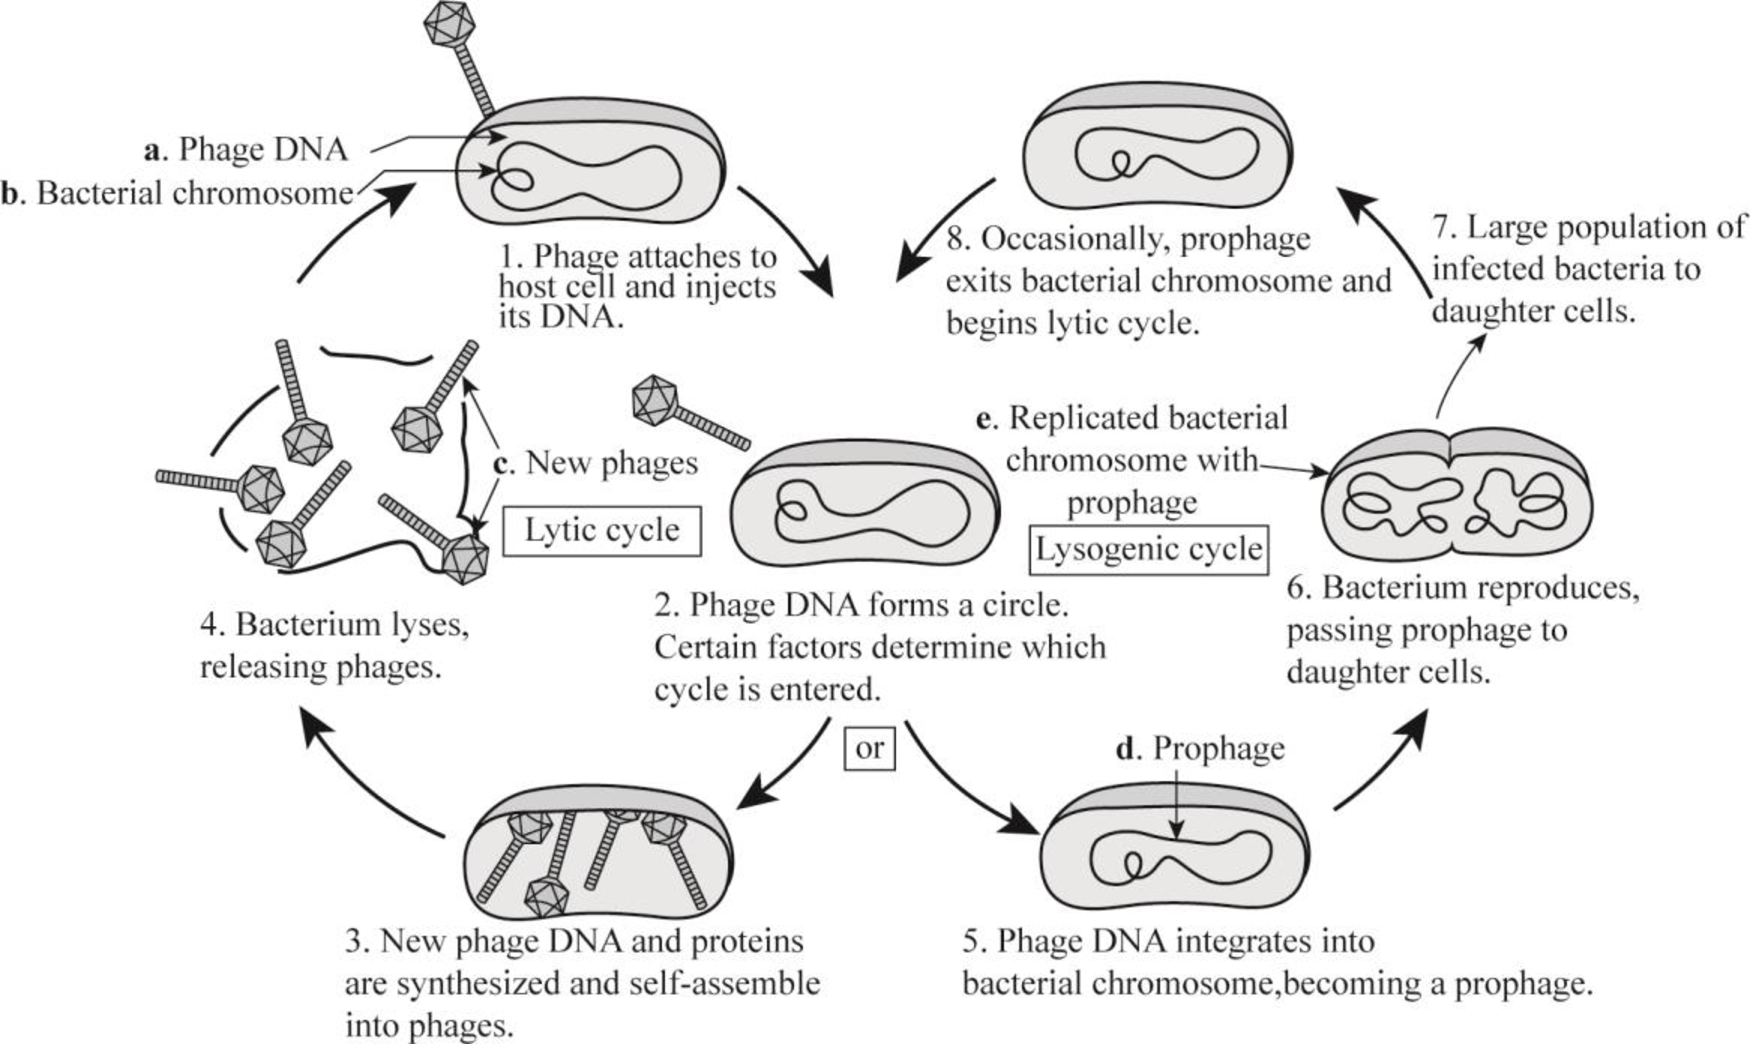
Fig.1: Lytic and lysogenic cycle
Explanation of Solution
Phages can infect and reproduce in the host cell by either of the two cycles— lysogenic cycle and lytic cycle. The lytic cycle is also known as virulent cycle, whereas the lysogenic cycle is a nonvirulent cycle. Attachment, penetration, uncoating, replication, assembly, and release are the steps involved in the replication of virus.
- During attachment and penetration, the virus attaches to a host cell and injects its genetic material into the host cell.
- During uncoating, the viral DNA or RNA enters to the nucleus of host cell and takes control over it.
- The host cell synthesizes the viral components.
- The newly-created virus release from the host cell either by lysis of cell, waiting for the cell to die, or by budding through cell membrane.
- In the lysogenic cycle, the phage DNA integrates to the bacterial chromosome and become prophage.
- Prophage is the genetic material of a bacteriophage that is incorporated to the genome of a bacterium and is able to produces phage if specifically activated.
- The bacteria reproduce by passing the prophage to daughter cells and a large population of infected bacteria forms.
- The prophage exits from the bacterial chromosome and starts the lytic cycle.
In lytic cycle, the viral DNA does not integrate with the bacterial DNA, but it destroys the host DNA and takes over the cellular replicative machinery in order to reproduce its own genome. In the lytic cycle, after the replication process is over, the host cell wall is lysed and new virions are released, whereas in the lysogenic cycle the virus does not destroy the host cell. It remains dormant and rarely produces virions during unfavorable conditions.
Want to see more full solutions like this?
Chapter 19 Solutions
Study Guide for Campbell Biology
Additional Science Textbook Solutions
Biological Science (6th Edition)
Genetics: From Genes to Genomes
Campbell Biology in Focus (2nd Edition)
Campbell Essential Biology (7th Edition)
HUMAN ANATOMY
Chemistry: A Molecular Approach (4th Edition)


- Biology lab problem To make 20 ul of 5 mM MgCl2 solution using 50 mM MgCl2 stock solution and distilled water, I will mix ________ ul of 50 mM MgCl2 solution and ________ ul of distilled water. Please help . Thank youarrow_forwardBiology Please help. Thank you. Biology laboratory question You need 50 ml of 1% (w/v) agarose gel. Agarose is a powder. How would you make it? You can ignore the volume of agarose powder. Don't forget the unit.TBE buffer is used to make an agarose gel, not distilled water. I will add _______ of agarose powder into 50 ml of distilled water (final 50 ml).arrow_forwardAn urgent care center experienced the average patient admissions shown in the Table below during the weeks from the first week of December through the second week of April. Week Average Daily Admissions 1-Dec 11 2-Dec 14 3-Dec 17 4-Dec 15 1-Jan 12 2-Jan 11 3-Jan 9 4-Jan 9 1-Feb 12 2-Feb 8 3-Feb 13 4-Feb 11 1-Mar 15 2-Mar 17 3-Mar 14 4-Mar 19 5-Mar 13 1-Apr 17 2-Apr 13 Forecast admissions for the periods from the first week of December through the second week of April. Compare the forecast admissions to the actual admissions; What do you conclude?arrow_forward
- Analyze the effectiveness of the a drug treatment program based on the needs of 18-65 year olds who are in need of treatment by critically describing 4 things in the program is doing effectively and 4 things the program needs some improvement.arrow_forwardI have the first half finished... just need the bottom half.arrow_forward13. Practice Calculations: 3 colonies were suspended in the following dilution series and then a viable plate count and microscope count was performed. Calculate IDF's, TDF's and then calculate the CFU/mL in each tube by both methods. Finally calculate the cells in 1 colony by both methods. Show all of your calculations in the space provided on the following pages. 3 colonies 56 cells 10 μL 10 μL 100 μL 500 με m OS A B D 5.0 mL 990 με 990 με 900 με 500 μL EN 2 100 με 100 μL 118 colonies 12 coloniesarrow_forward
- Describe and give a specific example of how successionary stage is related to species diversity?arrow_forwardExplain down bellow what happens to the cell in pictures not in words: Decreased pH in mitochondria Increased ATP Decreased pH in cytosol Increased hydrolysis Decreasing glycogen and triglycerides Increased MAP kinase activity Poor ion transport → For each one:→ What normally happens?→ What is wrong now?→ How does it mess up the cell?arrow_forward1.) Community Diversity: The brown and orange line represent two different plant communities. a. Which color represents the community with a higher species richness? b. Which color represents the community with a higher species evenness? Relative abundance 0.1 0.04 0.001 2 4 6 8 10 12 14 16 18 20 22 24 Rank abundance c. What is the maximum value of the Simpson's diversity index (remember, Simpson's index is D = p², Simpson's diversity index is 1-D)? d. If the Simpson's diversity index equals 1, what does that mean about the number of species and their relative abundance within community being assessed?arrow_forward
- 1.) Community Diversity: The brown and orange line represent two different plant communities. a. Which color represents the community with a higher species richness? b. Which color represents the community with a higher species evenness? Relative abundance 0.1 0.04 0.001 2 4 6 8 10 12 14 16 18 20 22 24 Rank abundance c. What is the maximum value of the Simpson's diversity index (remember, Simpson's index is D = p², Simpson's diversity index is 1-D)? d. If the Simpson's diversity index equals 1, what does that mean about the number of species and their relative abundance within community being assessed?arrow_forwardwhat measures can a mother to take to improve the produce of her to milk to her newborn baby ?arrow_forward1. Color the line that represents all ancestors of the Eastern white pine tree green (but only the ancestral line NOT shared with other organisms) 2. Oncle the last common ancestor of the Colorado blue spruce tree and Eastern white pine tree. 3. Put a box around the last common ancestor of the sugar maple tree and the dogwood tree. 4. Put a triangle around the last common ancestor of the red pine tree and the american holly bush. 5. Color the line that represents all ancestors of the Ponderosa pine tree red (including all shared ancestors). 6. Color the line that represents all ancestors of the American elm tree blue (including all shared ancestors). 7 Color the line that represents all ancestors of the Sabal palm tree purple (including all shared ancestors) 8. Using a yellow highlighter or colored pencil, circle the clade that includes all pine trees. 9. Using a orange highlighter or colored pencil, circle the clade that includes all gymnosperms 10. Can you tell…arrow_forward

 Anatomy & PhysiologyBiologyISBN:9781938168130Author:Kelly A. Young, James A. Wise, Peter DeSaix, Dean H. Kruse, Brandon Poe, Eddie Johnson, Jody E. Johnson, Oksana Korol, J. Gordon Betts, Mark WomblePublisher:OpenStax College
 Biology 2eBiologyISBN:9781947172517Author:Matthew Douglas, Jung Choi, Mary Ann ClarkPublisher:OpenStax
 Biology: The Unity and Diversity of Life (MindTap...BiologyISBN:9781305073951Author:Cecie Starr, Ralph Taggart, Christine Evers, Lisa StarrPublisher:Cengage Learning
 Human Heredity: Principles and Issues (MindTap Co...BiologyISBN:9781305251052Author:Michael CummingsPublisher:Cengage Learning