Concept explainers
Videos
A phase diagram for carbon and platinum is shown. It is assumed the lines shown are linear, and the mixture has the following characteristics. The endpoints of the division line between these two phases are labeled on the diagram.
■ Below 1700 degrees Celsius, it is a mixture of solid platinum (Pt) and graphite (G).
■ Above 1700 degrees Celsius, there are two possible phases: a Liquid (L) phase and a Liquid (L) + phase (G).
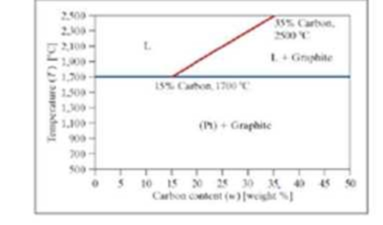
Write a program to determine the phase. The program should ask the user to enter the weight percent carbon and the temperature in degrees Celsius. Call the phases “Pt + G,” “L,” and “L + G,” for simplicity. If the point falls directly on the T = 1700°C line, include the point in the “Pt + G” phase. If the point falls directly on the L, L + Gline, include the point in the “L + G” phase.
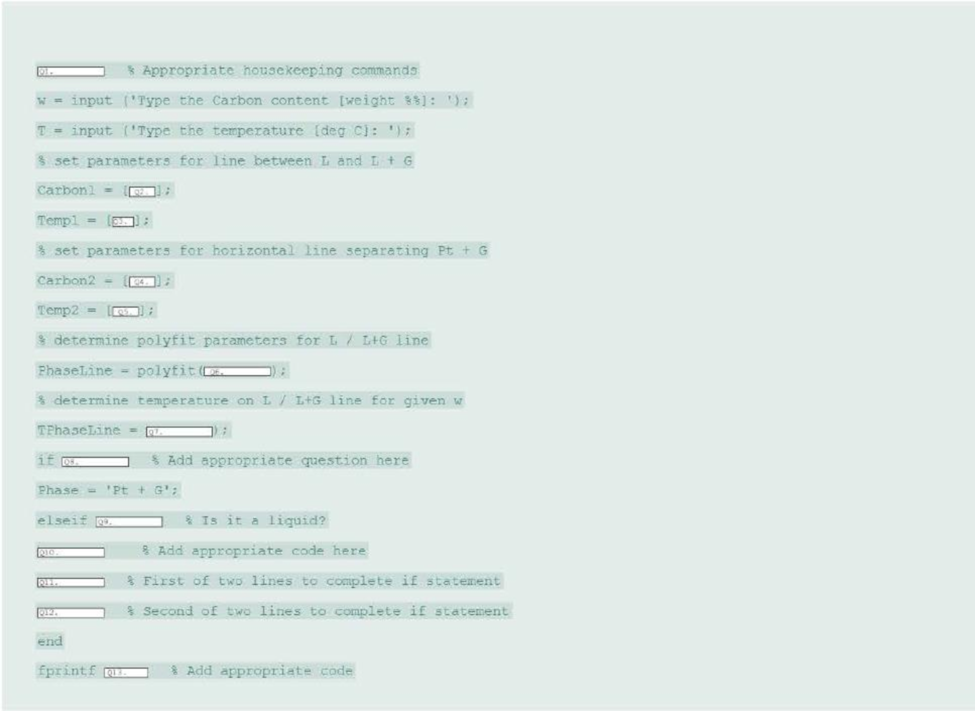
Store the phase as text in a variable. The equation of the line dividing the L and L + G phases must be found in the program using polyfit. The program should produce a formatted output statement to the command window. Similar to “For X.XX weight percent carbon and a temperature of YYY degrees Celsius, the phase is PHASE” where x.xx, yyy and PHASE are replaced by the actual values formatted as shown.
The following partial code is designed to implement this program. You are to fill in the missing sections of code as appropriate to complete the program.
Want to see the full answer?
Check out a sample textbook solution
Chapter 19 Solutions
Thinking Like an Engineer: An Active Learning Approach (3rd Edition)


- Q1: For the following force system, find the moments with respect to axes x, y, and zarrow_forwardQ10) Body A weighs 600 lb contact with smooth surfaces at D and E. Determine the tension in the cord and the forces acting on C on member BD, also calculate the reaction at B and F. Cable 6' 3' wwwarrow_forwardHelp ارجو مساعدتي في حل هذا السؤالarrow_forward
- Q3: Find the resultant of the force system.arrow_forwardQuestion 1 A three-blade propeller of a diameter of 2 m has an activity factor AF of 200 and its ratio of static thrust coefficient to static torque coefficient is 10. The propeller's integrated lift coefficient is 0.3.arrow_forward(L=6847 mm, q = 5331 N/mm, M = 1408549 N.mm, and El = 8.6 x 10¹⁴ N. mm²) X A ΕΙ B L Y Marrow_forward
- Calculate the maximum shear stress Tmax at the selected element within the wall (Fig. Q3) if T = 26.7 KN.m, P = 23.6 MPa, t = 2.2 mm, R = 2 m. The following choices are provided in units of MPa and rounded to three decimal places. Select one: ○ 1.2681.818 O 2. 25745.455 O 3. 17163.636 O 4. 10727.273 ○ 5.5363.636arrow_forwardIf L-719.01 mm, = 7839.63 N/m³, the normal stress σ caused by self-weight at the location of the maximum normal stress in the bar can be calculated as (Please select the correct value of σ given in Pa and rounded to three decimal places.) Select one: ○ 1. 1409.193 2. 845.516 O 3. 11273.545 ○ 4.8455.159 ○ 5.4509.418 6. 2818.386 7.5636.772arrow_forwardTo calculate the rotation at Point B, a suitable virtual structure needs to be created. Which equation in the following choices most accurately represents the functional relationship between the bending moment, Mv2 ( Units: N.mm), of the virtual structure and the spatial coordinate x (Units: mm) if the applied unit virtual moment is clockwise? Select one: O 1. Mv2 1.000 O 2. Mv2=x+1.000 O 3. Mv2=x+0.000 4. Mv2 = -x-1.000 O 5. Mv2 -1.000 6. Mv2=-x+0.000arrow_forward
 Elements Of ElectromagneticsMechanical EngineeringISBN:9780190698614Author:Sadiku, Matthew N. O.Publisher:Oxford University Press
 Mechanics of Materials (10th Edition)Mechanical EngineeringISBN:9780134319650Author:Russell C. HibbelerPublisher:PEARSON
 Thermodynamics: An Engineering ApproachMechanical EngineeringISBN:9781259822674Author:Yunus A. Cengel Dr., Michael A. BolesPublisher:McGraw-Hill Education
 Control Systems EngineeringMechanical EngineeringISBN:9781118170519Author:Norman S. NisePublisher:WILEY
 Mechanics of Materials (MindTap Course List)Mechanical EngineeringISBN:9781337093347Author:Barry J. Goodno, James M. GerePublisher:Cengage Learning
 Engineering Mechanics: StaticsMechanical EngineeringISBN:9781118807330Author:James L. Meriam, L. G. Kraige, J. N. BoltonPublisher:WILEY