
Concept explainers
Videos
(a)
(i)
The characteristics of field diagram, which indicates the objects R and T sign of chargesare positive and for object S is negative.
(ii)
The characteristics of field diagram, which indicates the objects R and T magnitude are equal and for object S is twice than that of object R and T.
Answer to Problem 41TP
- The characteristics of field diagram indicates the sign of the objects R and T which are positive and for object S as negative, which is described by the direction of field vectors.
- The characteristics of field diagramindicates the magnitude of the objects R and T as equal and for object S as twice than that of object R and T.The magnitude is described by the distance of field vectors.
Explanation of Solution
Introduction:
The lines of forces are imaginary which signify amplitude and direction of an electric field at any point. The lines of forces direction could be in opposite for positive and negative charged particles.
- The characteristics of field diagram indicates the magnitude of the objects R and T as equal and for object S as twice than that of object R and T. The magnitude is described by the distance of field vectors. The electric field in between the object S and T is the total electric field of object R,S and T.
- The field magnitude is given by
The R and T field magnitude are equal.
The vector length is same for the objects closest to R and T. And it starts from R and T in the same distance of about 4 units. Hence, the R and T charges could be same.
But the vector length of object S is same as of object R and T and it starts from larger distance like 6 units when compared to R and T.
The field vector starts from 4 units and field vector starts from 6 units are same and it is given as
Where
Substitute the corresponding units for distances
Hence the charge
Conclusion:
Therefore, by the characteristics of field diagram, which indicates the objects R and T sign of charges are positive and for object S is negative which is described by the direction of field vectors.
The characteristics of field diagram, which indicates the objects R and T magnitude, are equal and for object S is twice than that of object R and T which is described by the distance of field vectors.
(b)
To Plot:
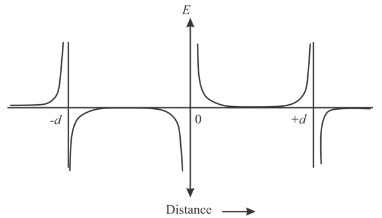
The graph of electric field E as a function of position of xalong the x-axis.
Answer to Problem 41TP
The graph of electric field E in position of x along the x- axis is plotted.
Explanation of Solution
Introduction:
The lines of forces are imaginary lines which signify amplitude and direction of an electric field at any point. The lines of forces direction could be opposite for positive and negative charged particles.
The graph of electric field E in position of x along the x-axis is plotted below.
(c)
An expression for electric field E in terms of charge, distance and fundamental constants.
Answer to Problem 41TP
The expression for electric field E in terms of charge, distance and fundamental constants is written as
Explanation of Solution
Introduction:
The lines of forces are imaginary lines which signify amplitude and direction of an electric field at any point. The lines of forces direction could be in opposite for positive and negative charged particles.The electric field in between the object S and T is the total electric field of object R, S and T.
The lines of forces direction could be in opposite for positive and negative charged particles. The lines of forces are imaginary lines which signify amplitude and direction of an electric field at any point. The electric field of object R at distance x from object S is given as,
The electric field of object S at distance x from object S is given as,
The electric field of object T at distance x from object S is given as,
The total electric field is given as
Hence the net electric field is
Conclusion:
Therefore,the expression for electric field E in terms of charge, distance and fundamental constants is written as
(d)
Whether the given statement is true or false by using the above representations.
Answer to Problem 41TP
The given statement is false.
Explanation of Solution
Introduction:
The lines of forces are imaginary lines which signify amplitude and direction of an electric field at any point. The electric field in between the object S and T is the total electric field of object R,S and T.
The expression for electric field E in terms of charge, distance and fundamental constants is written as
The statement is incorrect since the vector length in the region is non-zero.
From the equation, it is stated that the object R denominator is always greater than that the denominator of object T. But the numerators are same. Hence, the magnitude of S is smaller than that of T. Also, if the second term is positive, the whole term is positive.
Conclusion:
Therefore,the statement is not correct.
Want to see more full solutions like this?
Chapter 18 Solutions
College Physics


- Don't use ai to answer I will report you answerarrow_forwardA shopper standing 2.00 m from a convex security mirror sees his image with a magnification of 0.200. (Explicitly show on paper how you follow the steps in the Problem-Solving Strategy for mirrors found on page 1020. Your instructor may ask you to turn in this work.) (a) Where is his image (in m)? (Use the correct sign.) -0.4 m in front of the mirror ▾ (b) What is the focal length (in m) of the mirror? -0.5 m (c) What is its radius of curvature (in m)? -1.0 marrow_forwardAn amoeba is 0.309 cm away from the 0.304 cm focal length objective lens of a microscope.arrow_forward
- Two resistors of resistances R1 and R2, with R2>R1, are connected to a voltage source with voltage V0. When the resistors are connected in series, the current is Is. When the resistors are connected in parallel, the current Ip from the source is equal to 10Is. Let r be the ratio R1/R2. Find r. I know you have to find the equations for V for both situations and relate them, I'm just struggling to do so. Please explain all steps, thank you.arrow_forwardBheem and Ram, jump off either side of a bridge while holding opposite ends of a rope and swing back and forth under the bridge to save a child while avoiding a fire. Looking at the swing of just Bheem, we can approximate him as a simple pendulum with a period of motion of 5.59 s. How long is the pendulum ? When Bheem swings, he goes a full distance, from side to side, of 10.2 m. What is his maximum velocity? What is his maximum acceleration?arrow_forwardThe position of a 0.300 kg object attached to a spring is described by x=0.271 m ⋅ cos(0.512π⋅rad/s ⋅t) (Assume t is in seconds.) Find the amplitude of the motion. Find the spring constant. Find the position of the object at t = 0.324 s. Find the object's velocity at t = 0.324 s.arrow_forward
- Min Min is hanging from her spring-arms off the edge of the level. Due to the spring like nature of her arms she is bouncing up and down in simple harmonic motion with a maximum displacement from equilibrium of 0.118 m. The spring constant of Min-Min’s arms is 9560. N/m and she has a mass of 87.5 kg. What is the period at which she oscillates? Find her maximum speed. Find her speed when she is located 5.00 cm from her equilibrium position.arrow_forward(a) What magnification in multiples is produced by a 0.150 cm focal length microscope objective that is 0.160 cm from the object being viewed? 15.9 (b) What is the overall magnification in multiples if an eyepiece that produces a magnification of 7.90x is used? 126 × ×arrow_forwardGravitational Potential Energyarrow_forward
- E = кедо Xo A continuous line of charge lies along the x axis, extending from x = +x to positive infinity. The line carries positive charge with a uniform linear charge density 10. (a) What is the magnitude of the electric field at the origin? (Use the following as necessary: 10, Xo, and ke.) (b) What is the direction of the electric field at the origin? O O O O O O G -y +z ○ -z +x -x +yarrow_forwardInclude free body diagramarrow_forward2 Spring 2025 -03 PITT Calculate the acceleration of a skier heading down a 10.0° slope, assuming the coefficient of cold coast at a constant velocity. You can neglect air resistance in both parts. friction for waxed wood on wet snow fly 0.1 (b) Find the angle of the slope down which this skier Given: 9 = ? 8=10° 4=0.1arrow_forward
 College PhysicsPhysicsISBN:9781938168000Author:Paul Peter Urone, Roger HinrichsPublisher:OpenStax College
 Principles of Physics: A Calculus-Based TextPhysicsISBN:9781133104261Author:Raymond A. Serway, John W. JewettPublisher:Cengage Learning
 Physics for Scientists and Engineers: Foundations...PhysicsISBN:9781133939146Author:Katz, Debora M.Publisher:Cengage Learning
 Physics for Scientists and Engineers, Technology ...PhysicsISBN:9781305116399Author:Raymond A. Serway, John W. JewettPublisher:Cengage Learning
 College PhysicsPhysicsISBN:9781285737027Author:Raymond A. Serway, Chris VuillePublisher:Cengage Learning
 College PhysicsPhysicsISBN:9781305952300Author:Raymond A. Serway, Chris VuillePublisher:Cengage Learning