
Videos
Your supervisor has assigned you the task of designing a set of measuring spoons with a “futuristic” shape. After considerable effort, you have come up with two geometric shapes that you believe are really interesting.
You make prototypes of five spoons for each shape with different depths and measure the volume each will hold. The following table shows the data you collected.
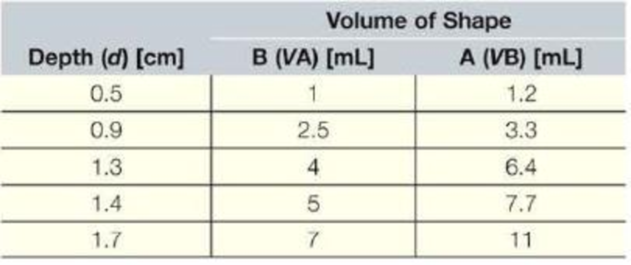
Create a proper plot of the data. Use polyflt to determine power models for each data set. For each model, add the trendline and the associated trend line equation to the graph. Use an appropriate location for the equations to clearly associate them with the correct trendline.
Use your models to determine the depths of a set of measuring spoons comprising the following volumes for each of the two designs. V = [¼ tsp, ½ tsp, ¾ tsp, + tsp, + Tbsp]. NOTE: + Tbsp = 3 tsp
Print the results to the Command Window in a table similar to the following format.

Want to see the full answer?
Check out a sample textbook solution
Chapter 18 Solutions
Thinking Like an Engineer: An Active Learning Approach (3rd Edition)


- Please help, make sure it's to box out and make it clear what answers go where...arrow_forwardPlease help, make sure it's to box out and make it clear what answers go where...arrow_forwardA triangular distributed load of max intensity w acts on beam AB. The beam is supported by a pin at A and member CD, which is connected by pins at C and D respectively. Determine the largest load intensity, Wmax, that can be applied if the pin at D can support a maximum force of 18000 N. Also determine the reactions at A and C and express each answer in Cartesian components. Assume the masses of both beam and member ✓ are negligible. Dwas шал = A BY NC SA 2016 Eric Davishahl C D -a- Ур -b- X B W Values for dimensions on the figure are given in the following table. Note the figure may not be to scale. Variable Value a 6.6 m b 11.88 m C 4.29 m The maximum load intensity is = wmax N/m. The reaction at A is A = The reaction at C is = i+ Ĵ N. ĴN. 12 i+arrow_forward
- The beam is supported by a pin at B and a roller at C and is subjected to the loading shown with w =110 lb/ft, and F 205 lb. a.) If M = 2,590 ft-lb, determine the support reactions at B and C. Report your answers in both Cartesian components. b.) Determine the largest magnitude of the applied couple M for which the beam is still properly supported in equilibrium with the pin and roller as shown. 2013 Michael Swanbom CC BY NC SA M ру W B⚫ C F ka b Values for dimensions on the figure are given in the following table. Note the figure may not be to scale. Variable Value a 3.2 ft b 6.4 ft C 3 ft a.) The reaction at B is B = The reaction at C is C = ĵ lb. i+ Ĵ lb. b.) The largest couple that can be applied is M ft-lb. == i+arrow_forwardThe beam ABC has a mass of 79.0 kg and is supported by the rope BDC that runs through the frictionless pulley at D . The winch at C has a mass of 36.5 kg. The tension in the rope acts on the beam at points B and C and counteracts the moments due to the beam's weight (acting vertically at the midpoint of its length) and the weight of the winch (acting vertically at point C) such that the resultant moment about point A is equal to zero. Assume that rope segment CD is vertical and note that rope segment BD is NOT necessarily perpendicular to the beam. a.) Compute the tension in the rope. b.) Model the two forces the rope exerts on the beam as a single equivalent force and couple moment acting at point B. Enter your answer in Cartesian components. c.) Model the two forces the rope exerts on the beam as a single equivalent force (no couple) and determine the distance from A to the point along the beam where the equivalent force acts (measured parallel to the beam from A ). Enter your answer…arrow_forwardw1 Three distributed loads act on a beam as shown. The load between A and B increases linearly from 0 to a maximum intensity of w₁ = 12.8 lb/ft at point B. The load then varies linearly with a different slope to an intensity of w₂ = 17.1 lb/ft at C. The load intensity in section CD of the beam is constant at w3 10.2 lb/ft. For each load region, determine the resultant force and the location of its line of action (distance to the right of A for all cases). cc 10 BY NC SA 2016 Eric Davishahl = WI W2 W3 -b- C Values for dimensions on the figure are given in the following table. Note the figure may not be to scale. Variable Value a 4.50 ft b 5.85 ft с 4.28 ft The resultant load in region AB is FR₁ = lb and acts ft to the right of A. The resultant load in region BC is FR2 lb and acts = ft to the right of A. The resultant load in region CD is FR3 = lb and acts ft to the right of A.arrow_forward
- The T-shaped structure is embedded in a concrete wall at A and subjected to the force F₁ and the force-couple system F2 1650 N and M = 1,800 N-m at the locations shown. Neglect the weight of the structure in your calculations for this problem. = a.) Compute the allowable range of magnitudes for F₁ in the direction shown if the connection at A will fail when subjected to a resultant moment with a magnitude of 920 N- m or higher. b.) Focusing on the forces and igonoring given M for now. Using the value for F1, min that you calculated in (a), replace the two forces F₁ and F2 with a single force that has equivalent effect on the structure. Specify the equivalent →> force Feq in Cartesian components and indicate the horizontal distance from point A to its line of action (note this line of action may not intersect the structure). c.) Now, model the entire force system (F1,min, F2, and M) as a single force and couple acting at the junction of the horizontal and vertical sections of the…arrow_forwardThe heated rod from Problem 3 is subject to a volumetric heating h(x) = h0 x L in units of [Wm−3], as shown in the figure below. Under the heat supply the temperature of the rod changes along x with the temperature function T (x). The temperature T (x) is governed by the d following equations: − dx (q(x)) + h(x) = 0 PDE q(x) =−k dT dx Fourier’s law of heat conduction (4) where q(x) is the heat flux through the rod and k is the (constant) thermal conductivity. Both ends of the bar are in contact with a heat reservoir at zero temperature. Determine: 1. Appropriate BCs for this physical problem. 2. The temperature function T (x). 3. The heat flux function q(x). Side Note: Please see that both ends of bar are in contact with a heat reservoir at zero temperature so the boundary condition at the right cannot be du/dx=0 because its not thermally insulated. Thank youarrow_forwardThe elastic bar from Problem 1 spins with angular velocity ω about an axis, as shown in the figure below. The radial acceleration at a generic point x along the bar is a(x) = ω2x. Under this radial acceleration, the bar stretches along x with displacement function u(x). The displacement d u(x) is governed by the following equations: dx (σ(x)) + ρa(x) = 0 PDE σ(x) = E du dx Hooke’s law (2) where σ(x) is the axial stress in the rod, ρ is the mass density, and E is the (constant) Young’s modulus. The bar is pinned on the rotation axis at x = 0 and it is also pinned at x = L. Determine: 1. Appropriate BCs for this physical problem. 2. The displacement function u(x). 3. The stress function σ(x). SIDE QUESTION: I saw a tutor solve it before but I didn't understand why the tutor did not divide E under the second term (c1x) before finding u(x). The tutor only divided E under first term. please explain and thank youarrow_forward
- calculate the total power required to go 80 mph in a VW Type 2 Samba Bus weighing 2310 lbs. with a Cd of 0.35 and a frontal area of 30ft^2. Consider the coefficient of rolling resistance to be 0.018. What is the increase in power required to go the same speed if the weight is increased by 2205 pounds (the rated carrying capacity of the vehicle). If the rated power for the vehicle is 49 bhp, will the van be able to reach 80 mph at full carrying capacity?arrow_forwardA distillation column with a total of 13 actual stages (including a partial condenser) is used to perform a separation which requires 7 ideal stages. Calculate the overall column efficiency, and report your answer in %arrow_forward6. Consider a 10N step input to the mechanical system shown below, take M = 15kg, K = 135N/m, and b = 0.4 Ns/m. (a) Assume zero initial condition, calculate the (i) System pole (ii) System characterization, and (iii) The time domain response (b) Calculate the steady-state value of the system b [ www K 个 х M -F(+)arrow_forward
 Elements Of ElectromagneticsMechanical EngineeringISBN:9780190698614Author:Sadiku, Matthew N. O.Publisher:Oxford University Press
 Mechanics of Materials (10th Edition)Mechanical EngineeringISBN:9780134319650Author:Russell C. HibbelerPublisher:PEARSON
 Thermodynamics: An Engineering ApproachMechanical EngineeringISBN:9781259822674Author:Yunus A. Cengel Dr., Michael A. BolesPublisher:McGraw-Hill Education
 Control Systems EngineeringMechanical EngineeringISBN:9781118170519Author:Norman S. NisePublisher:WILEY
 Mechanics of Materials (MindTap Course List)Mechanical EngineeringISBN:9781337093347Author:Barry J. Goodno, James M. GerePublisher:Cengage Learning
 Engineering Mechanics: StaticsMechanical EngineeringISBN:9781118807330Author:James L. Meriam, L. G. Kraige, J. N. BoltonPublisher:WILEY